OPEC finds itself crossing its fingers that the price falls of last week are a washout of positioning and not a structural change.
Both Brent and West Texas Intermediate (WTI) ended down some 9% last week. An emotional fall from grace as record speculative long positioning in both was shown the door after three months of stagnation. The CFTC Commitment of Traders report released last Friday only captures positioning up to the previous Tuesday and thus will not have captured just how many oil bulls remain “committed” to their views as of Friday. This week’s release on Friday the 17th will.
The Saudis, in particular, will be casting a nervous eye on it. They have unfortunately ended up in the unwanted role of swing producer, wearing most of the pain of OPEC/NOPEC cuts to prop up prices. They will be hoping that the price action of last week is a washout of positioning and not a structural change to the market. It ends up being a lose-lose situation for them otherwise. Cutting production to prop up prices, losing market share, and now looking down the barrel of lower prices after a brief rally of a few months. OPEC’s renewal meeting on the 25th of May could be emotional indeed, and one suspects the Saudi’s will be looking to share the heavy lifting more equitably judging by media comments by officials.
One can’t really blame them in all honesty; they’ve not had much help from their OPEC and non-OPEC allies. Producers such as Libya and Nigeria were given a leave pass from the deal altogether. The Iraqis and Iranians both ramped up production ahead of the cut start date and have signaled they have plenty of production ammunition ready to go when it rolls off. The Russians, the world’s largest producer daily at some 11 million barrels a day (bpd), have managed to cut a paltry 150,000 bpd of their target of 300,000 bpd and we are three months into the reduction period. Thanks for nothing guys.
But it is the ramp-up in U.S. shale that has really caught the world and OPEC on the hop. The Baker Hughes Rig Count showed yet more of those fracking rigs (sic) added last week, with the U.S. rig count hitting 768, up from 480 a year ago. The ability of shale to be profitable above $50 a barrel despite the prices of the best shale acreage exploding in price is impressive. Given their pace of innovation, they may well be profitable at much lower levels than that. Something to cause sleepless nights at OPEC’s HQ in Vienna.
The other factor is just how much of the other side of those record speculative longs in the futures markets was shale oil hedging future production. As I have said in the past, the new world of shale financing means they are obliged to forward hedge and lock in profits via the futures markets. For once the banks may have done them a favour as shale may have—by luck or design—hedged out their downside risk to a certain extent giving them effectively even deeper pockets.
The whole situation must be a game theorists nightmare for the Saudis and the UAE. Having led the charge to get the production cut deal across the line, they may not even have the prisoners dilemma option of “taking the deal first,” as most of their competition seems to have taken it simultaneously already.
OPEC/NOPEC can expect no help from U.S. shale in future production cut deals either even if they wanted to. The shale industry is fractured (pardon the pun), with many producers and no single dominant one. There is no government body as per so much of OPEC that controls the industry. Most importantly cartel-like behaviour is absolutely against the law in the United States. There is a reason that De Beers, for instance, has no corporate presence in the U.S.A.
Coming back to the here and now, the charts make for interesting reading today.
Brent Crude (spot)
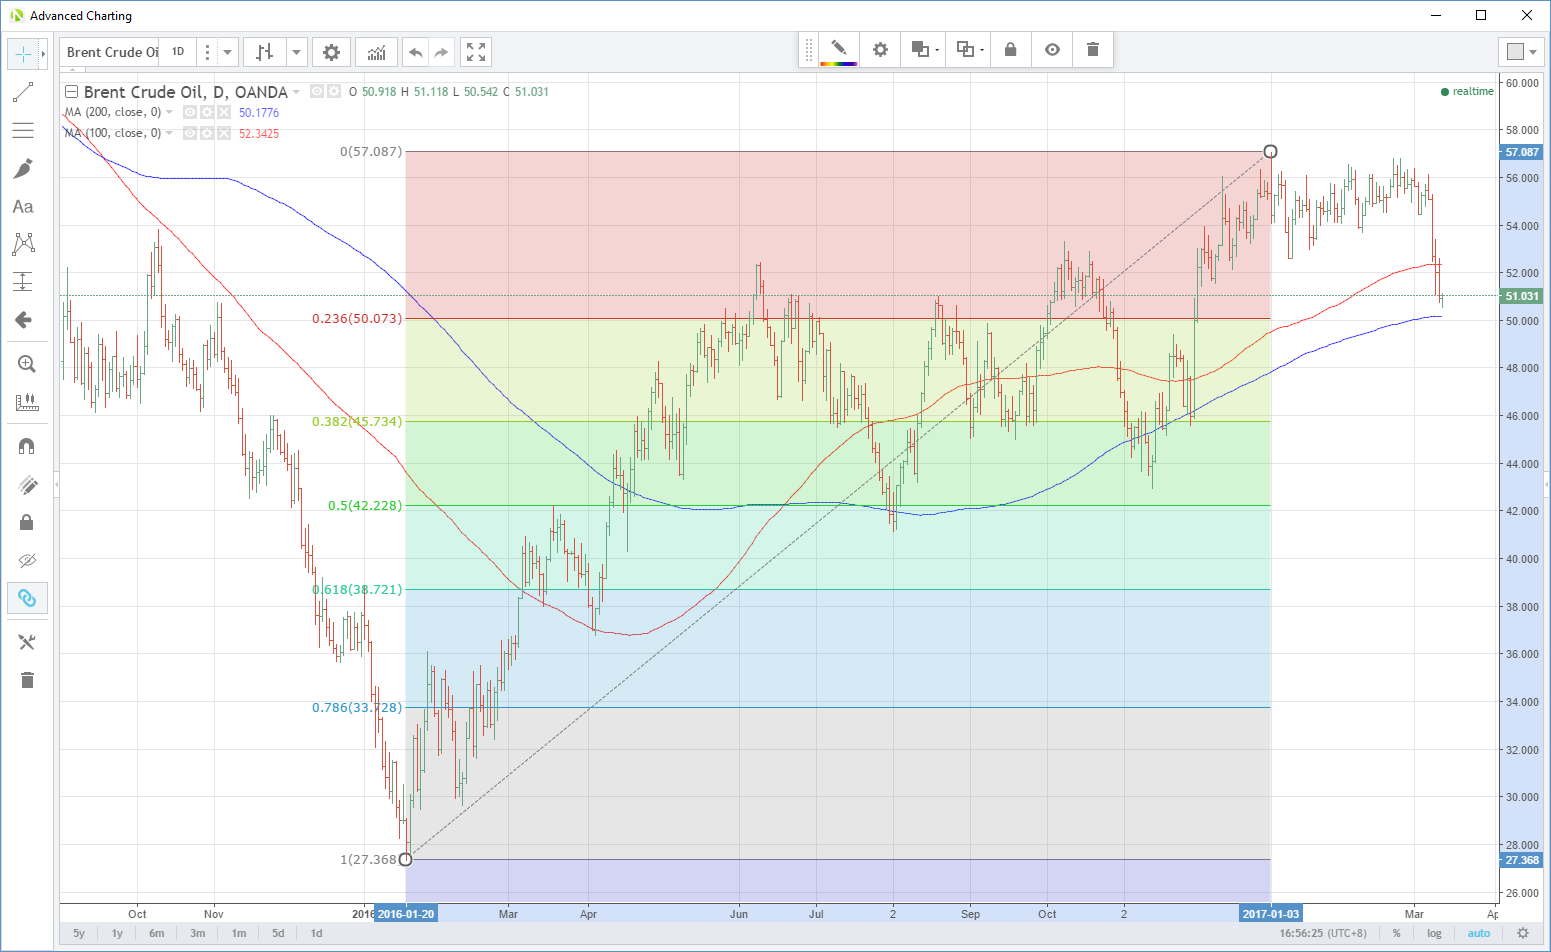
Brent has managed to catch some breath today but is still perched precariously just above $50. Resistance is above at the 100-day moving average (dma) at $52.34.
Support initially comes in at $50.1770, the 200-dma and then the 23.60% Fibonacci retracement at %50.07. (the move from the 2016 lows at $27.368 to the January 1st highs at $57.00)
For simplicity’s sake let's just say that the $50.00 a barrel area, therefore, is an important support zone. A lot of clear air appears after this until the $45.75/$45.75 regions. The 38.2% fibo retrace and the low of 29th November.

West Texas Intermediate (spot)
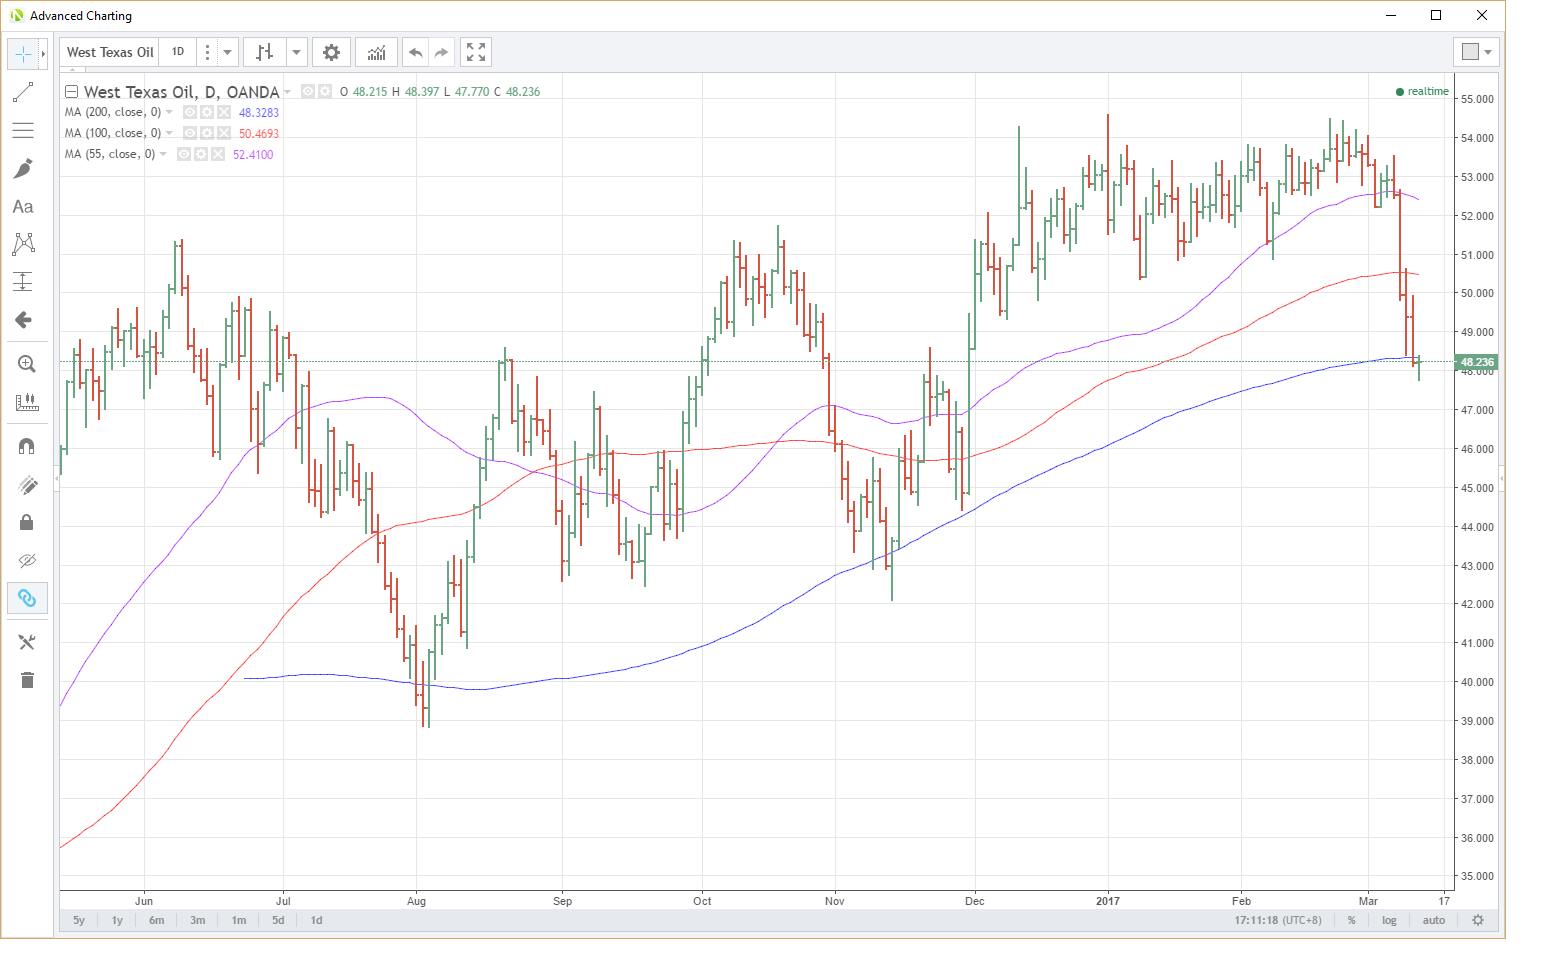
Broke $50.00 a barrel last week and is currently sitting around its 200-dma at $48.3300. A daily close above here is vital to give bulls a semblance of hope of some sort of correction from a technical basis. Above here resistance sits at $50.4700, the 100-dma.
Support is at the day’s low at $47.7700 and then clear air until the 29th November low at $44.4300.

Summary
Oil is not out of the woods from a technical perspective. Short-term the charts and the price action still appear to be quite bearish potentially. There is a lot of event risk this week, but the culmination will be the COT report on Friday. This will capture the price action of last week and go a long way to informing whether most of the pain has been taken by speculators, or whether there are more tears ahead. In the bigger picture OPEC and particularly Saudi Arabia as the swing producer, could be in an undesirable position heading into the middle of the year.
