NVDA Q3 Earnings Alert: Why our AI stock picker is still holding Nvidia stockRead More

Oil’s Price Slump And The Stock-Market Rout

Published 02/24/2016, 11:58 AM
Updated 05/14/2017, 06:45 AM
US500
-
SPY
-
CL
-
USO
-

The most popular meme in the stock market today is that as oil moves so do equities. It has gotten to the point where pundits and prognosticators think this is obvious. Does that mean that that when oil sells off there are algorithmic programs designed to sell stocks now? I can’t answer that.

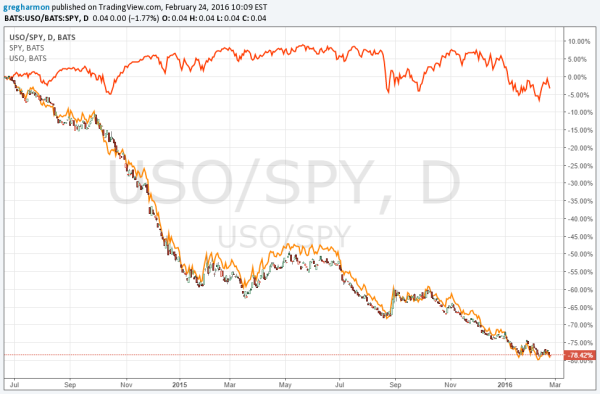
What I can do is take a look at the relationship between oil and stocks though. With real data. The chart below looks at the ratio of the price of the oil ETF (N:USO) to the S&P 500 ETF SPY since oil prices started their rapid fall in July 2014. If you cannot make it out the ratio is the red and green line trending lower. Also on the chart is the SPY performance over this time, and the performance of the oil ETF itself.

Oil Vs. Stocks

It might just be me, but it appears that the price of the Oil ETF USO (yellow line) is pretty highly correlated to the ratio between oil and stocks. Also the SPY seems to be moving mostly sideways, unperturbed by the machinations of oil or the ratio. If you see something different let me know.

So as stocks move sideways oil is falling and the ratio of oil to stocks is falling in lockstep with oil. This does not appear to be a strong correlation, or any correlation for that matter.

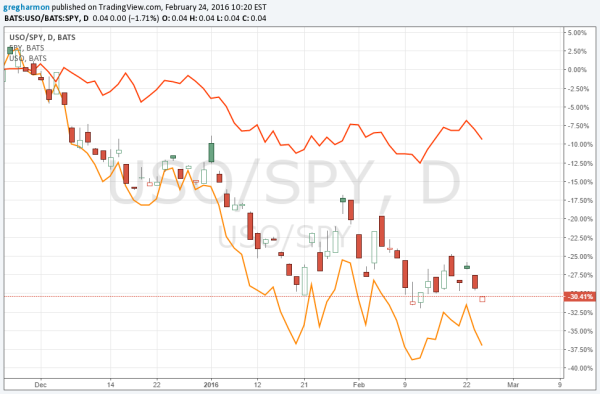
But maybe it is just a more recent phenomenon. Focusing on the last 3 months, in the chart below, does not really change the picture much. There now appears to be a short-term correlation in direction. As oil falls over the three months stocks have fallen too.

Oil And Stocks Fall Together

Is it a predictable, day-to-day correlation? It starts to appear so to me, but hey I am not a rocket scientist. Knowing the directional correlation sure might help. But I find it curious that as the meme became more entrenched, the directional correlation came to be.

Will it take a predictability in the magnitude of the swing to put an end to the algorithms trading this way as new ones try to front run the changes? Or will everyone finally get bored and end this meme?

If you are trading based on this correlation I urge you to look again at the top chart. The connection between oil and the market is the outlier, not the norm. Manage risk for the time that changes.

Original post

Latest comments

Loading next article…
Risk Disclosure: Trading in financial instruments and/or cryptocurrencies involves high risks including the risk of losing some, or all, of your investment amount, and may not be suitable for all investors. Prices of cryptocurrencies are extremely volatile and may be affected by external factors such as financial, regulatory or political events. Trading on margin increases the financial risks.
Before deciding to trade in financial instrument or cryptocurrencies you should be fully informed of the risks and costs associated with trading the financial markets, carefully consider your investment objectives, level of experience, and risk appetite, and seek professional advice where needed.
Fusion Media would like to remind you that the data contained in this website is not necessarily real-time nor accurate. The data and prices on the website are not necessarily provided by any market or exchange, but may be provided by market makers, and so prices may not be accurate and may differ from the actual price at any given market, meaning prices are indicative and not appropriate for trading purposes. Fusion Media and any provider of the data contained in this website will not accept liability for any loss or damage as a result of your trading, or your reliance on the information contained within this website.
It is prohibited to use, store, reproduce, display, modify, transmit or distribute the data contained in this website without the explicit prior written permission of Fusion Media and/or the data provider. All intellectual property rights are reserved by the providers and/or the exchange providing the data contained in this website.
Fusion Media may be compensated by the advertisers that appear on the website, based on your interaction with the advertisements or advertisers.
© 2007-2024 - Fusion Media Limited. All Rights Reserved.