Early in another week of May, the commodity market is looking quite stable. Brent is slightly falling and trading close to $68.50, while WTI is retreating towards $68.14.
The statistics from Baker Hughes on the Oil Rig Count in the USA showed 352 units, which is an 8 unit increase relative to the weak before. The Total Rig Count expanded by 5, up to 453 units.
The market pressure reduced along with the bullish activity when the Colonial Pipeline reopened. The pipeline fuels the eastern coast of the USA that’s why its shutdown was pretty much painful for the population. It is known that the company had to pay hackers 75 Bitcoin for recovery of the lost data after which the system managed to get back to its relatively normal state and started operating properly.
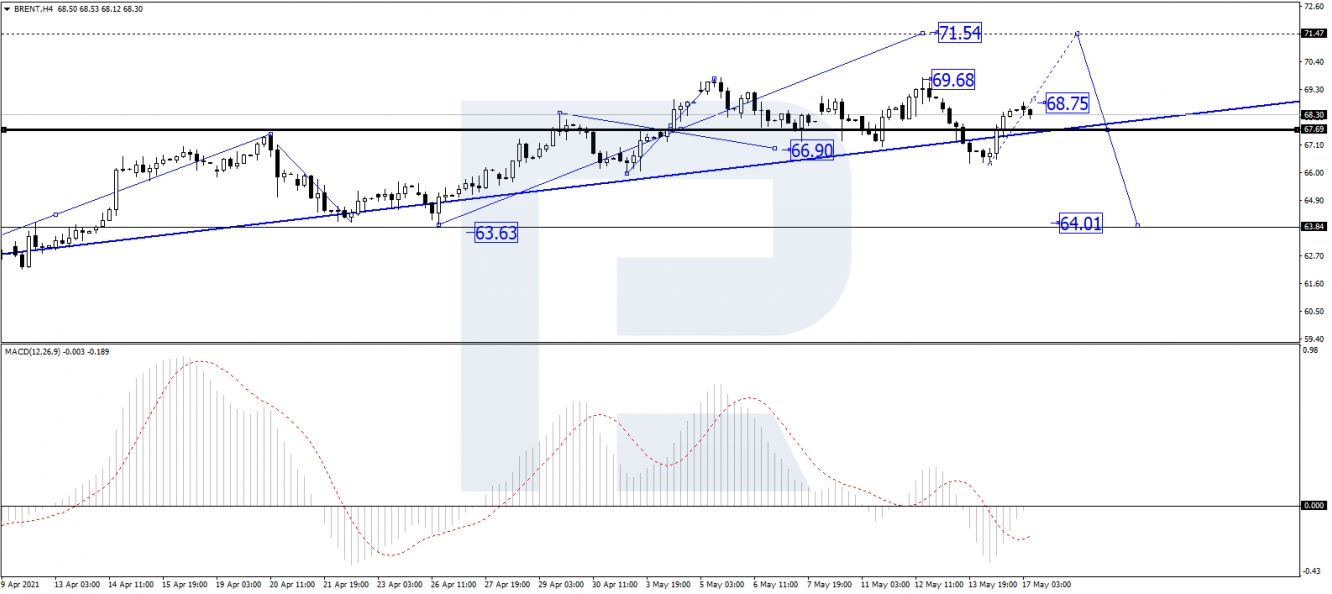
In the H4 chart, after finishing the correctional wave at 66.40, Brent is forming one more correctional structure with the short-term target at 71.55. Later, the market may start another correction to reach 64.00 and then resume trading upwards with the target at 75.00. From the technical point of view, this scenario is confirmed by MACD Oscillator: its signal line is moving below 0 outside the histogram area, which is a signal in favor of further growth.
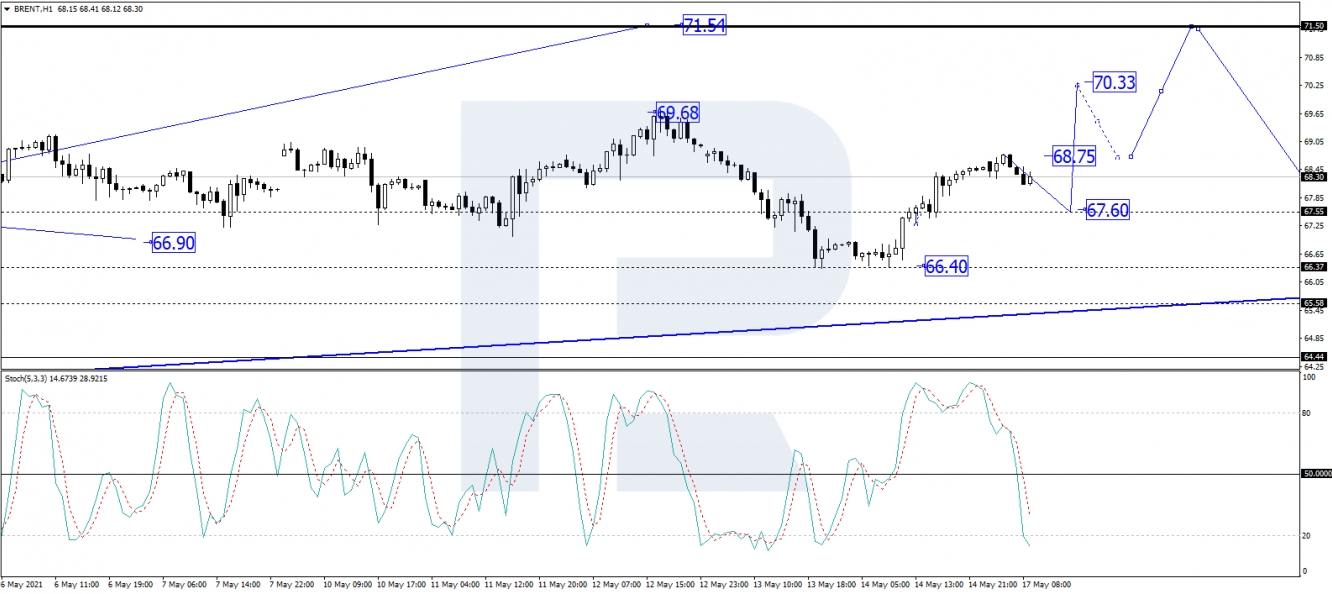
As we can see in the H1 chart, after reaching the first upside target at 68.75, Brent is expected to correct towards 67.60. Later, the market may form another ascending structure with the short-term target at 70.33. From the technical point of view, this idea is confirmed by the Stochastic Oscillator: its signal line moving below 20, which means that the asset may soon finish the descending wave and resume growing on the price chart.

Disclaimer: Any predictions contained herein are based on the authors' particular opinion. This analysis shall not be treated as trading advice. RoboForex shall not be held liable for the results of the trades arising from relying upon trading recommendations and reviews contained
- English (UK)
- English (India)
- English (Canada)
- English (Australia)
- English (South Africa)
- English (Philippines)
- English (Nigeria)
- Deutsch
- Español (España)
- Español (México)
- Français
- Italiano
- Nederlands
- Português (Portugal)
- Polski
- Português (Brasil)
- Русский
- Türkçe
- العربية
- Ελληνικά
- Svenska
- Suomi
- עברית
- 日本語
- 한국어
- 简体中文
- 繁體中文
- Bahasa Indonesia
- Bahasa Melayu
- ไทย
- Tiếng Việt
- हिंदी
Oil Looking Stable
Latest comments
Loading next article…
Install Our App
Risk Disclosure: Trading in financial instruments and/or cryptocurrencies involves high risks including the risk of losing some, or all, of your investment amount, and may not be suitable for all investors. Prices of cryptocurrencies are extremely volatile and may be affected by external factors such as financial, regulatory or political events. Trading on margin increases the financial risks.
Before deciding to trade in financial instrument or cryptocurrencies you should be fully informed of the risks and costs associated with trading the financial markets, carefully consider your investment objectives, level of experience, and risk appetite, and seek professional advice where needed.
Fusion Media would like to remind you that the data contained in this website is not necessarily real-time nor accurate. The data and prices on the website are not necessarily provided by any market or exchange, but may be provided by market makers, and so prices may not be accurate and may differ from the actual price at any given market, meaning prices are indicative and not appropriate for trading purposes. Fusion Media and any provider of the data contained in this website will not accept liability for any loss or damage as a result of your trading, or your reliance on the information contained within this website.
It is prohibited to use, store, reproduce, display, modify, transmit or distribute the data contained in this website without the explicit prior written permission of Fusion Media and/or the data provider. All intellectual property rights are reserved by the providers and/or the exchange providing the data contained in this website.
Fusion Media may be compensated by the advertisers that appear on the website, based on your interaction with the advertisements or advertisers.
© 2007-2025 - Fusion Media Limited. All Rights Reserved.
