The new week has brought a decline for major indices with interesting movements in the commodities sector. This has happened in the absence of higher volatility by USD, which usually has a significant impact on commodity prices. The USD has been locked in a sideways trend for the past couple of days and we are expecting a bigger movement to come about.
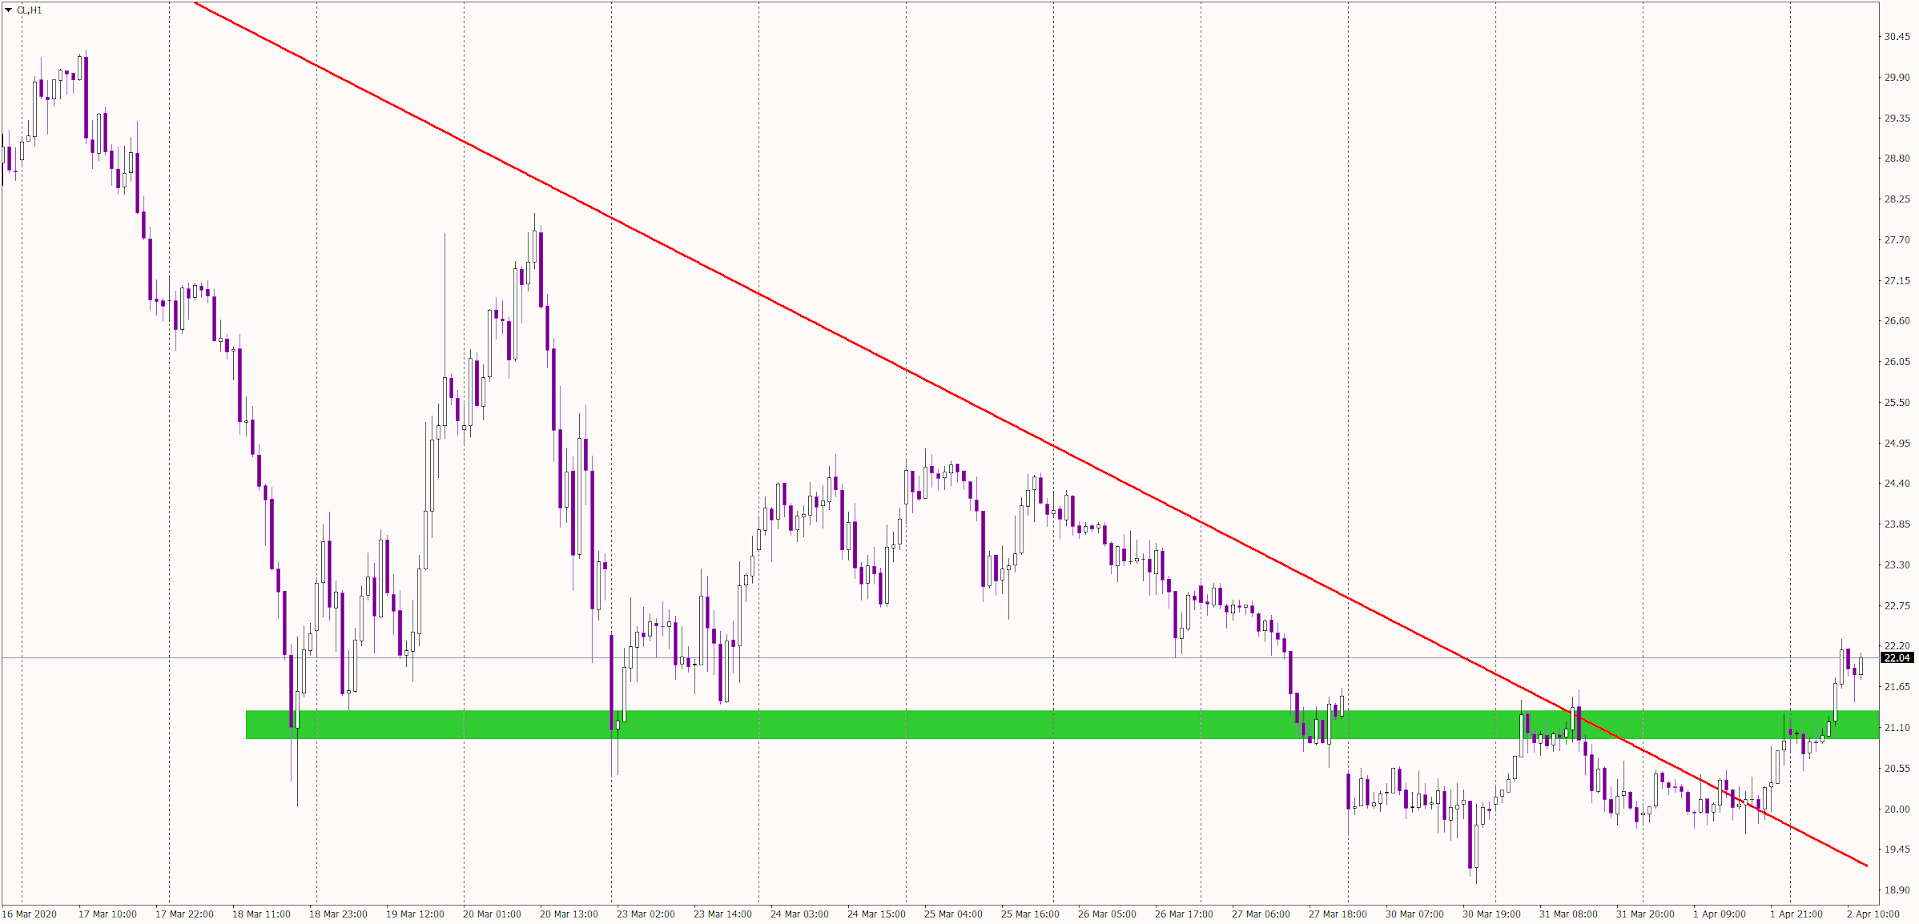
Let’s start with oil which may be returning from a long downward journey. The price of oil flirted with 19 USD/bbl. level for the first three days of this week, turning it into a support level as the price jumped higher. Price action traders can easily spot a crucial resistance level at around 21.1 USD/oz, a level that was broken today and is now being tested as a support level. If the price closes today above that line it can be a good short-term buying opportunity.

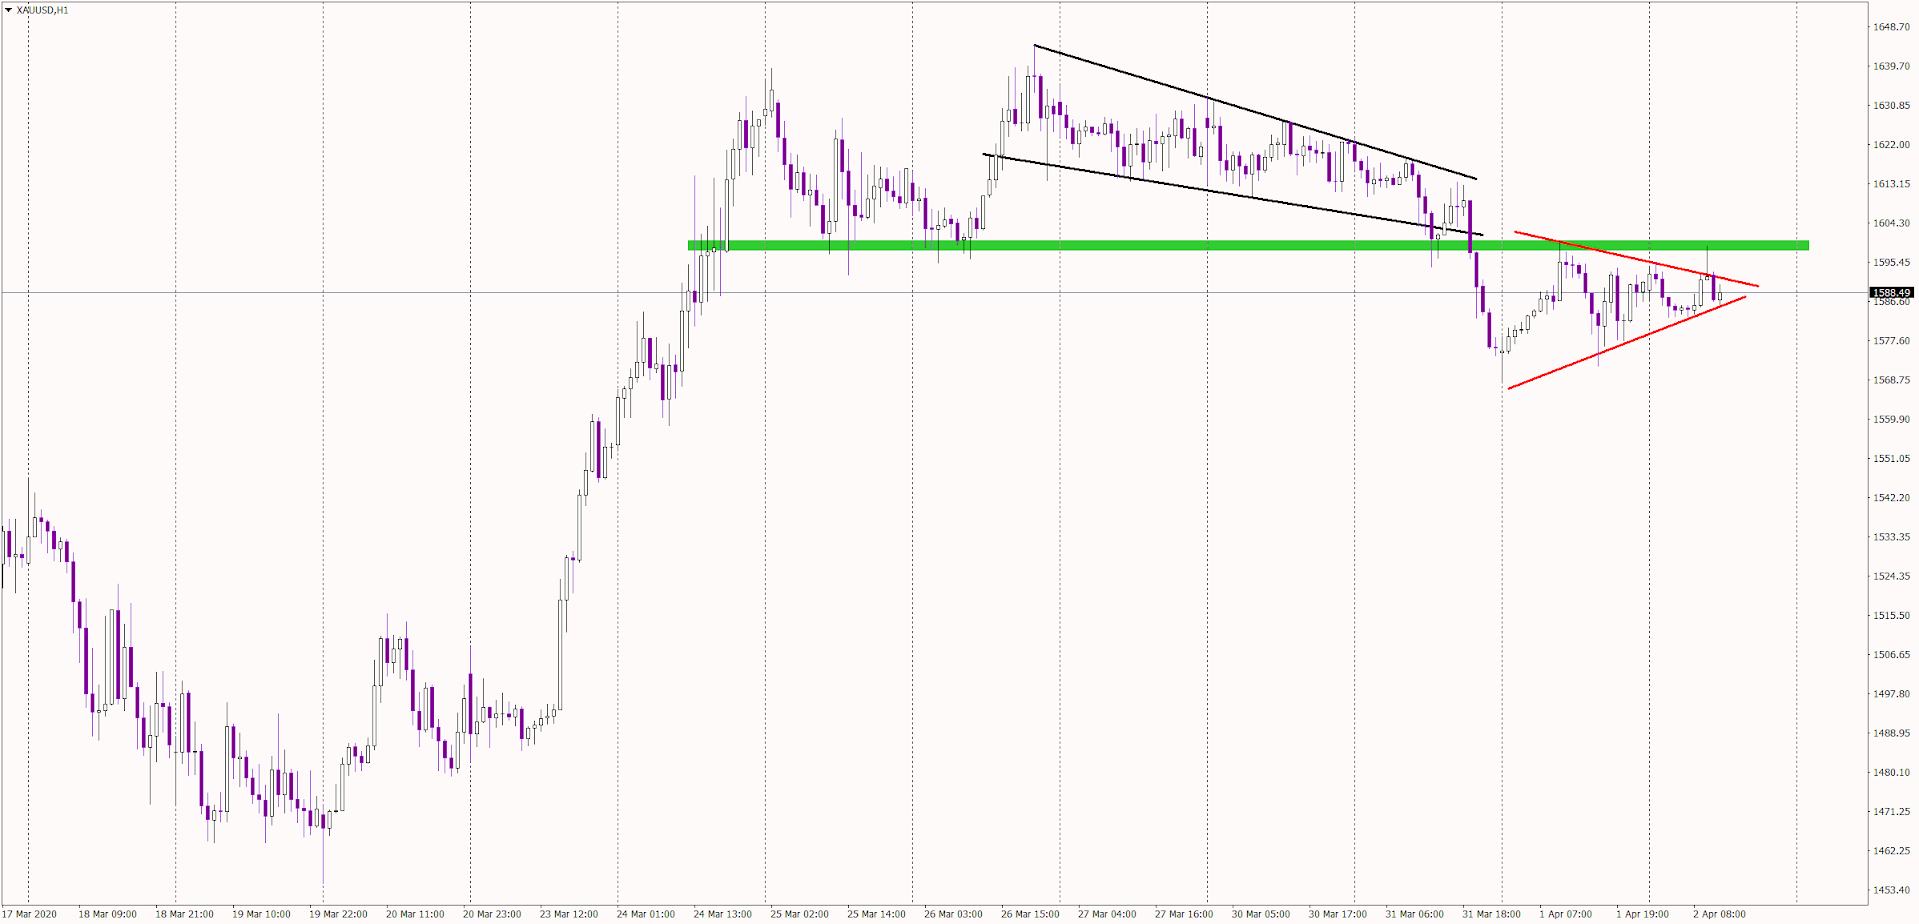
Meanwhile, gold has found a new resistance. The wedge from the end of March has failed and instead of breaking the upper line, the price fell. Sellers have managed to break the psychological barrier of 1600 USD/oz, which is currently the closest level to resistance. The latest attempt to break that level failed and the price created a nice shooting star on the hourly chart. That does not indicate optimism for buyers.

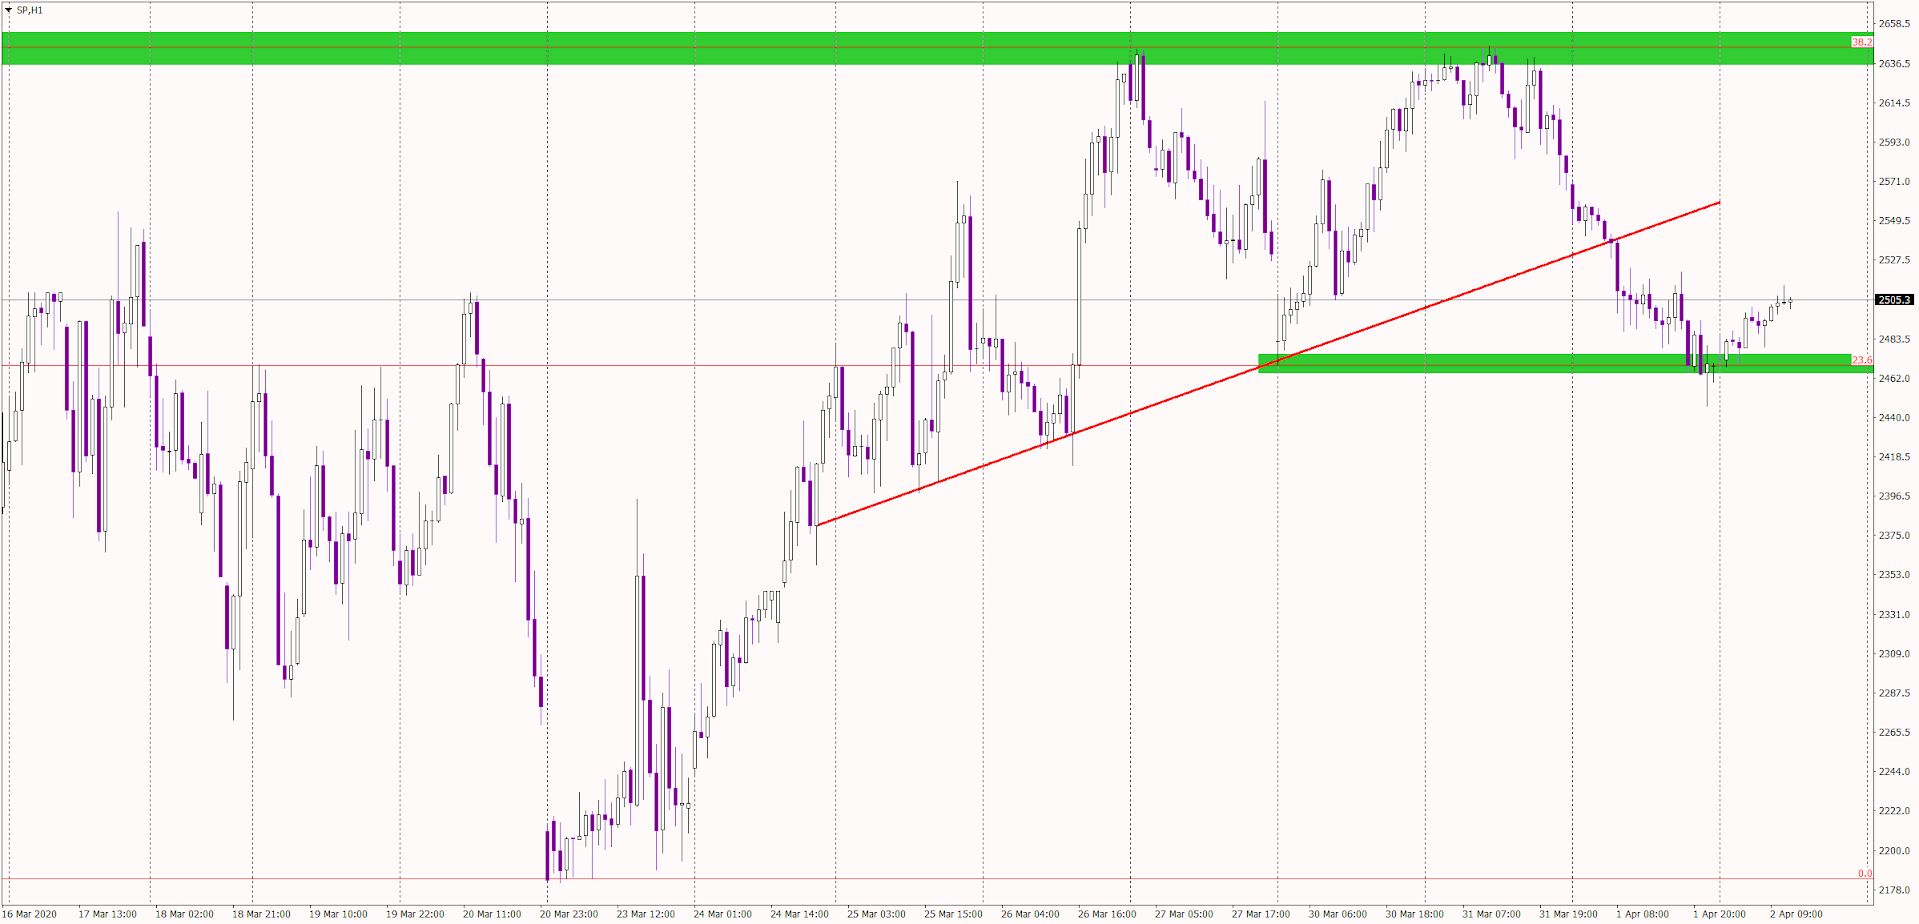
Lastly, let’s take a quick look at indices which seem to have remained under the influence of the bounce from the 38,2% Fibonacci retracement level. We can also see a sweet head and shoulders patters with a neckline, which has already been broken. Yesterday we mentioned that after a breakout of the neckline, a new resistance is likely to be tested, so we warned traders of a temporary pullback and this is exactly what’s happening now. Indices prices are moving significantly higher following contact with the 23,6% Fibonacci level. However, it’s not time to get too optimistic, the long-term sentiment remains negative.

