Talking Points:- Risk-buying dominated Asian session, weakened USD
- Oil recovered but topside is weak before EIA & API data
- Copper surged with China demand, despite sufficient supply
- Gold steadied as Fed stopped communication until September meeting
Risk trades continued in the Asian morning after a buoyant session in Europe and US, following an Asian stock rally the previous day. Commodities, Australian dollar and New Zealand dollar posted notable gains, with iron ore and Nikkei up over five percent at one point. The consequent fall in US dollar precipitated as most assets in Asia time zone are associated with risk.
Optimism was reinstated in expectation of more China stimulus as the Financial Times reported that China's Ministry of Finance posted on its website that it would carry out "stronger proactive fiscal policy".
Copper spiked to 2.4755 near Asian noon time after a rally during the New York session eluded to the biggest surge since 2013. China’s rising copper imports and newly-approved railway projects were welcomed reprieves for the metal after slowing usage and oversupply drove prices to a six-year low in August, which led to recent mine shutdowns, including Glencore PLC's (OTC:GLNCY).
Copper inventories tracked by the London Metal Exchange eased up after reaching a peak on August 28 and yesterday’s stockpile was near August low at 0.346 million tons. However the below graph shows that inventories are still exceedingly high compare with levels in 2014, which is a drag on price outlook.

Oil was on a winning streak this morning in line with risk-asset buying, after a slump in New York session preempted delayed reports from EIA and API. Due to the US Labor Day holiday, weekly data from both the industry-funded American Petroleum Institute and government-funded Energy Information Administration will be released today and are expected to show another increase in stockpiles.
The flip side of recent oil volatility showed in a Bloomberg report that investors withdrew from United States Oil (NYSE:USO), the biggest oil ETF fund, at the fastest pace last week since its inception in 2006.
As price tension escalated, occasional statements continued flowing from OPEC, this time from Iran’s oil minister Zanghaneh that Mexico would participate in the group’s coordinated efforts to stabilize prices, without mentioning any concrete steps. A main event for now may be the readmission of Indonesia into OPEC, expectedly by December.
Gold carried on its recent correlation with commodity complex, partly driven by US dollar weakness. It consistently rose in the Asian morning before stabilizing under today’s high at 1125.48. The upcoming silence from Federal Reserve members during blackout period (no external communication) up to September meeting may ease some downward pressure on prices and keep gold in a range.
Good news on gold demand came in a report of Times of India, that the cabinet will discuss a proposal to allow Indians to deposit gold with banks and earn interest on it.
GOLD TECHNICAL ANALYSIS
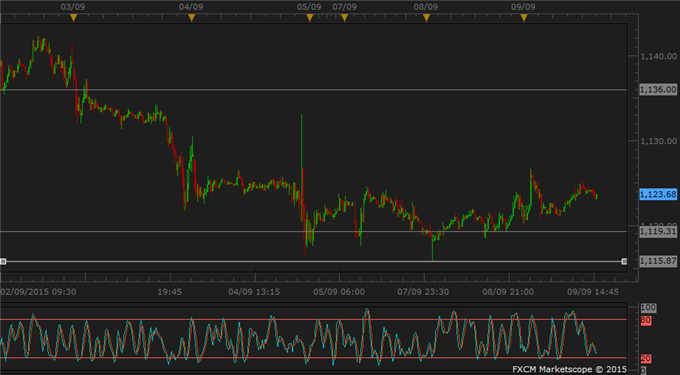
Gold remained in a range with occasional volatility driven by market sentiment. It piggybacked risk rally earlier in Asia although interests seemed to wane after noon time. The intraday chart shows support levels at 1119.3 then 1115.8. There is little opportunity in gold at present as it swung between negative and positive correlations with risk-trade.

COPPER TECHNICAL ANALYSIS
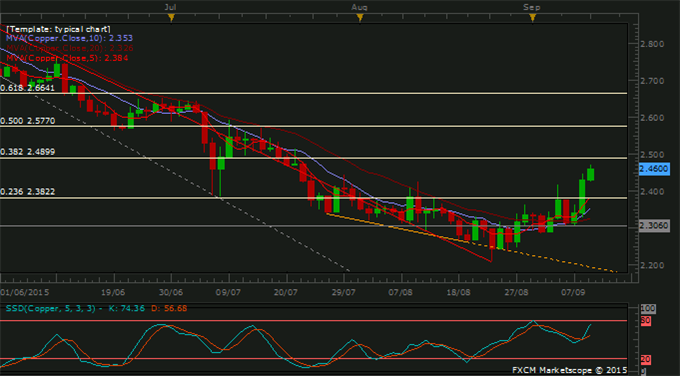
Copper again paused its climb ahead of 38.2% Fibo and resistance level at 2.4899. Moving averages have align into signal of an uptrend although volatility persists at this early stage. Momentum signals nearing the upper bound is a deterrence to copper bulls. With this in mind. the bulls may still enter long trades at any dip towards 23.6% Fibo with tight stops around current resistance.

CRUDE OIL TECHNICAL ANALYSIS
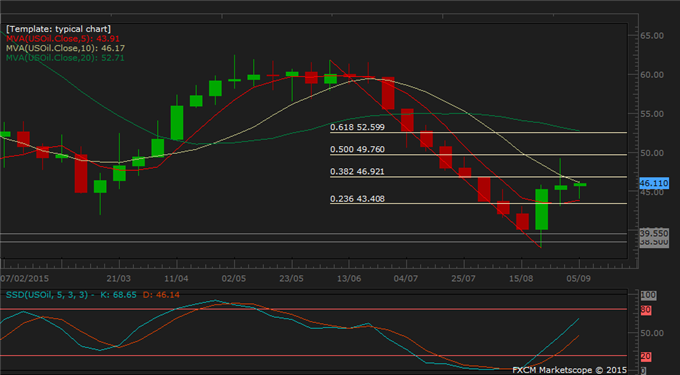
Finding resistance levels is the issue now that oil started on an unfading winning streak. The weekly chart offers an immediate resistance at 38.2% Fibo at 46.92, topped by 50% Fibo at 49.76 where oil had stopped at during the late August rally. Both short and long trades may be based on these levels.

