Since the August 21 low, the NASDAQ has been grinding higher in what appears at first hand a set of random ups and downs. But, when we start to apply Elliot Wave Theory and associated Fib-extension and retraces we all of a sudden can observe an orderly advance that is currently following a standard pattern.
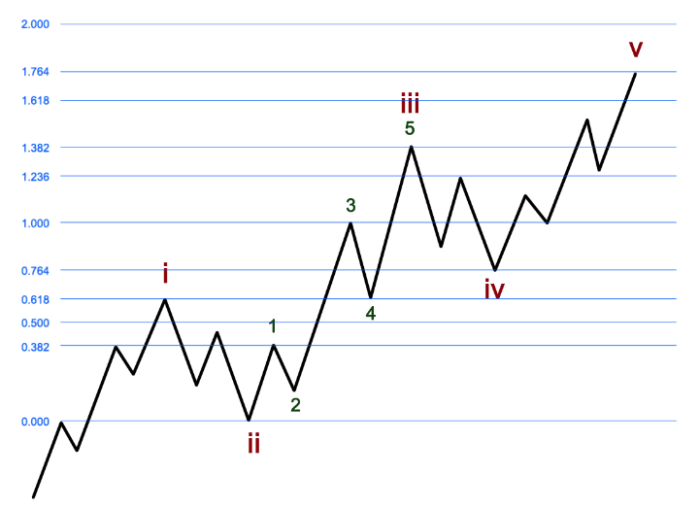
This standard pattern has been laid out by our friends at Elliot Wave Trader and is shown below. What follows is that in a standard impulse wave up, wave-3 of wave-iii targets the 1.000x extension of wave-i, and wave-4 declines to the 0.618x extension. Wave-5 then advances to the 1.382x extension to complete all of wave-iii. So far a nice theory. Let’s put it to the test.
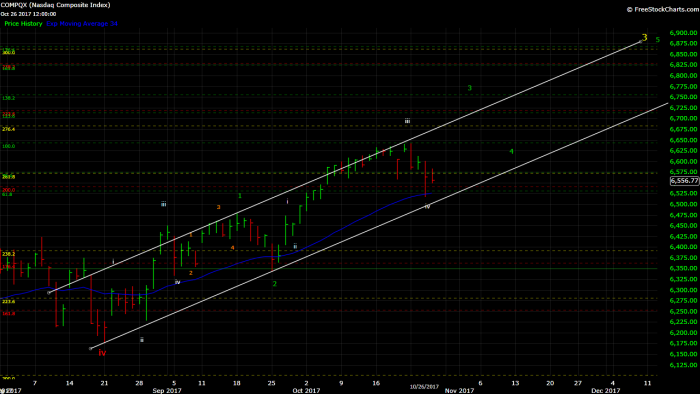
Below is the daily chart of the NAS and we have a (green) minor-1 off the (red) intermediate-iv low struck on August 24. Why a first wave? As it consists of 5 none-overlapping waves, with a sub-dividing 5th wave. This corresponds to wave-i in the above example. After minor-2, price then advanced to exactly the 1.000x extension for minute-iii of minor-3 a few days ago and then declined to the 0.618x extension yesterday. Exactly as shown and outlined in the example above. Perfect. Now with GOOGL, AMZN, MSFT all up 3-8% after-hours, and QQQ (the ETF that tracks the NAS) also up 1% it appears that minute-v of minor-3 to the 1.382x extension is now underway. That would target $6765 on the NAS.

Once price strikes that Fib-extension region we should expect a minor-4 decline (minute-iv on the S&P) to ideally the 0.764x extension, after which a final last rally (minor-5) should take price to the 1.764x extension with a 5=1 relationship to complete all of intermediate-v and therewith (yellow) major-3. That extension is also exactly the 3.000x extension of major-1 as can be seen in the chart above. When smaller and larger waves’ Fib-extensions coincide it’s at their final targets it is always prudent to pay special attention.
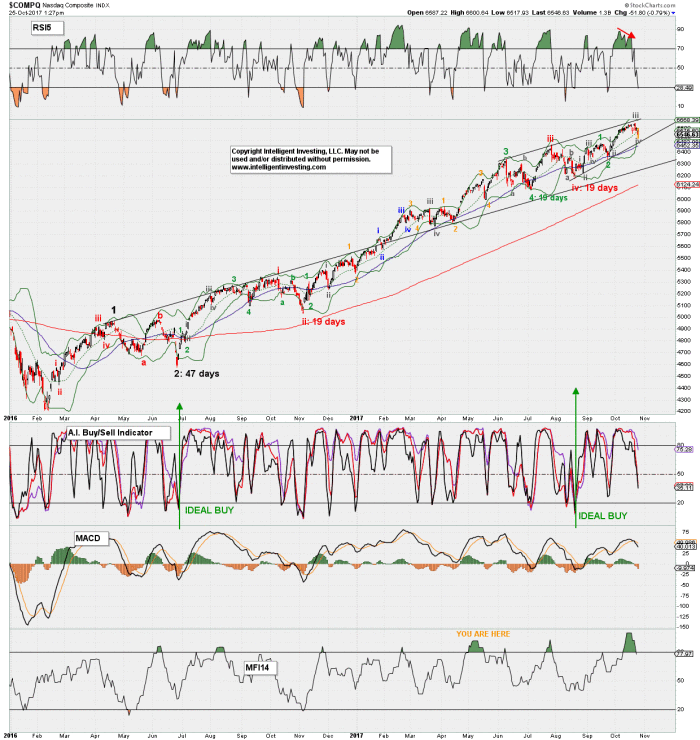
The chart below shows the big-picture count I have for the NAS as it shows the most important waves, including the aformentioned major (here in black), intermediate, minor and minute waves. What is also interesting is that each 4th wave correction since the (black) major-2 low lasted 19 days, while major-2 its self was 47 days long. Hence, the upcoming major-4 correction should be a multi-month affair.
In addition, please note that the Money Flow Index peaked recently, and price hardly ever peaks on peak money flow as markets are liquidity driven. We should therefore continue to expect higher prices going forward, while money will be pull out of the market (MFI will drop), which fits with the aformentioned wave count.
