✂ Fed’s first rate cut since 2020: Use our free Stock Screener to find new opportunities fastExplore for FREE

NYSE Advancing/Declining Issues Entering Correction Territory

Published 08/10/2017, 11:40 AM
Updated 07/09/2023, 06:31 AM
US500
-


One of the most followed gauges of the market is the (cumulative) NYSE's Advancing/Declining issues line (NYAD); it simple follows how many stocks are advancing vs decline (and unchanged). If more stocks are advancing the ratio increases, and vice versa if more stocks are declining. By adding each day's A/D number to the previous we'll get the cumulative number. This thus gives us a "look under the hood" in determining if a rally is sustained (many stocks are participating) or if it's running out of steam (fewer and fewer stocks are participating).

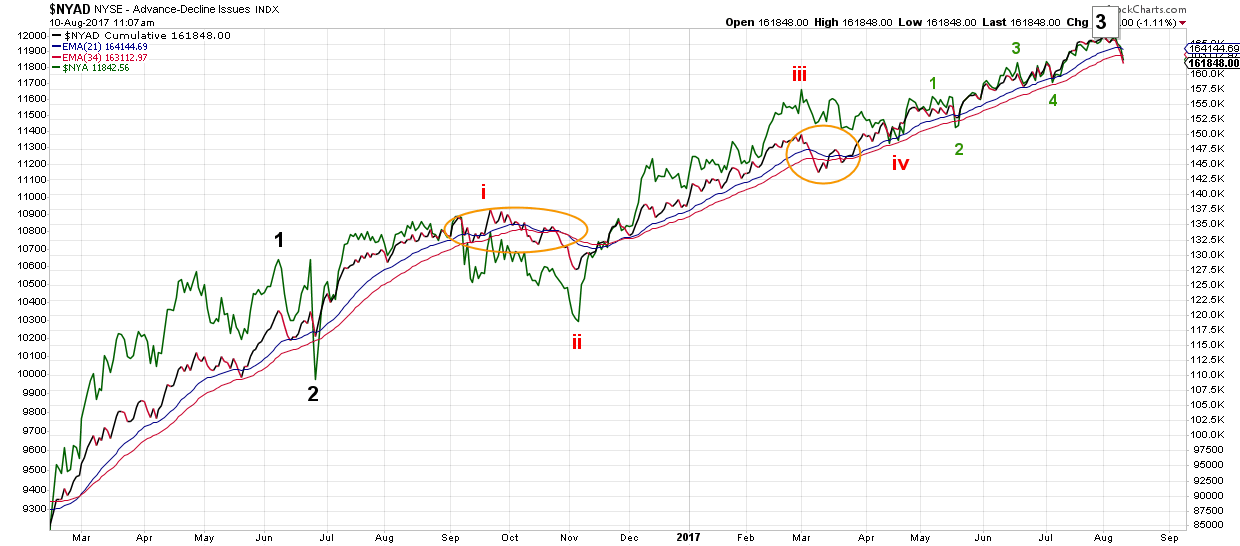
If we then add moving averages for trend-following we can determine if the NYAD is trending up (and so is the index) or if it is trending down. Below is a plot of the cumulative NYAD with two exponential moving averages (EMAs): the 21-day and 34-day. The NYSE index is in green with Elliot Wave labeling.
NYAD Chart
Today the cumulative NYAD dropped below both of the EMAs and therewith signals the market has entered a correction. In fact, the orange circles show the last two times, since the February 2016 low, when the NYAD dropped below both EMAs: both were longer and deeper corrections. It is thus logical to conclude the market is currently experiencing a similar longer and deeper correction. This is in line with my preferred view of the market where I've anticipated a larger top for quite some time: see here and here for example.

One of my market-breadth based buy/sell indicators already switched to sell last Friday (August 4) after several days of dismal breadth (negative) made it flip from buy/long to sell/short, which I alerted my premium members to in my weekend update; avoiding them a lot of the current pain many are experiencing now.

Together with the cumulative NYAD entering corrective mode, the weight of the evidence is therefore mounting for a larger correction, especially since the S&P 500 reversed on Tuesday at SPX2491, which is exactly from within the ideal target zone of SPX2488-2502 I forecasted in my earlier post. I will provide an update on this breadth-based buy/sell indicator next week.

Latest comments

Loading next article…
Risk Disclosure: Trading in financial instruments and/or cryptocurrencies involves high risks including the risk of losing some, or all, of your investment amount, and may not be suitable for all investors. Prices of cryptocurrencies are extremely volatile and may be affected by external factors such as financial, regulatory or political events. Trading on margin increases the financial risks.
Before deciding to trade in financial instrument or cryptocurrencies you should be fully informed of the risks and costs associated with trading the financial markets, carefully consider your investment objectives, level of experience, and risk appetite, and seek professional advice where needed.
Fusion Media would like to remind you that the data contained in this website is not necessarily real-time nor accurate. The data and prices on the website are not necessarily provided by any market or exchange, but may be provided by market makers, and so prices may not be accurate and may differ from the actual price at any given market, meaning prices are indicative and not appropriate for trading purposes. Fusion Media and any provider of the data contained in this website will not accept liability for any loss or damage as a result of your trading, or your reliance on the information contained within this website.
It is prohibited to use, store, reproduce, display, modify, transmit or distribute the data contained in this website without the explicit prior written permission of Fusion Media and/or the data provider. All intellectual property rights are reserved by the providers and/or the exchange providing the data contained in this website.
Fusion Media may be compensated by the advertisers that appear on the website, based on your interaction with the advertisements or advertisers.
© 2007-2024 - Fusion Media Limited. All Rights Reserved.