This looks like a crazy rally, but it's normal for NVIDIA (NASDAQ:NVDA)
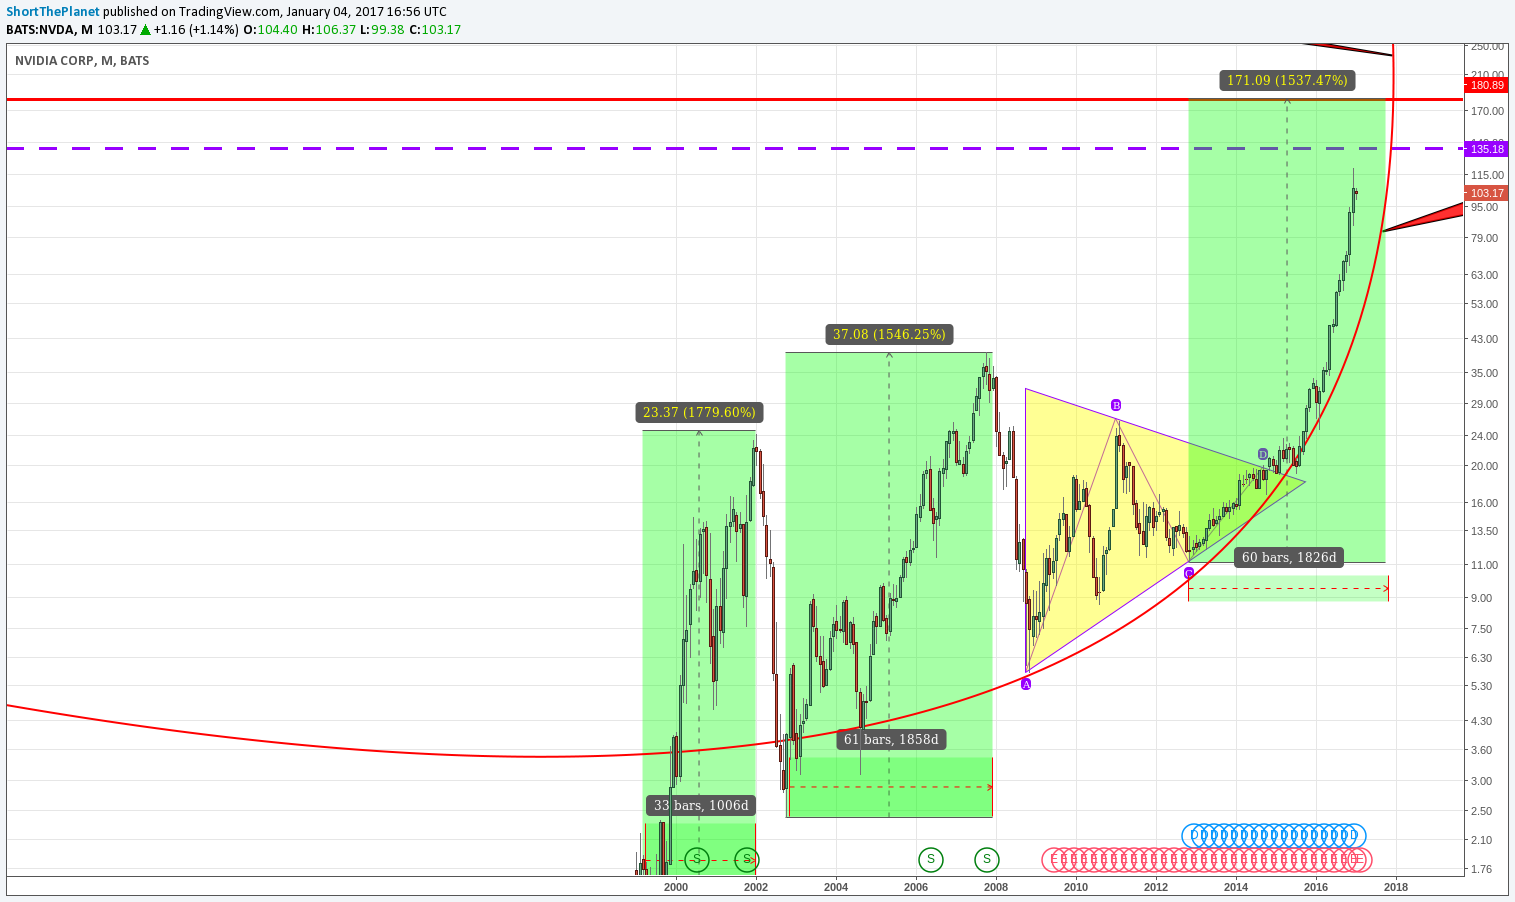
During the recent years the price of NVIDIA shares, which are traded on NASDAQ exchange, rose more than 10 times. No matter what news could cause that, let's look at this rally from the technical point of view. Look at the chart:

1,500% growth in 3-5 years is typical for this asset
NVIDIA already had such rallies in 2000-2002 and 2004-2008. Both of them had the similar percetage of growth: 1,779% and 1,546%. So we can say that this is typical for NVIDIA, and nothing special is happening right now. Except the fact that the current rally is the third one, which means once it finishes, the bigger and longer term correction is expected. Not just "a few years break".
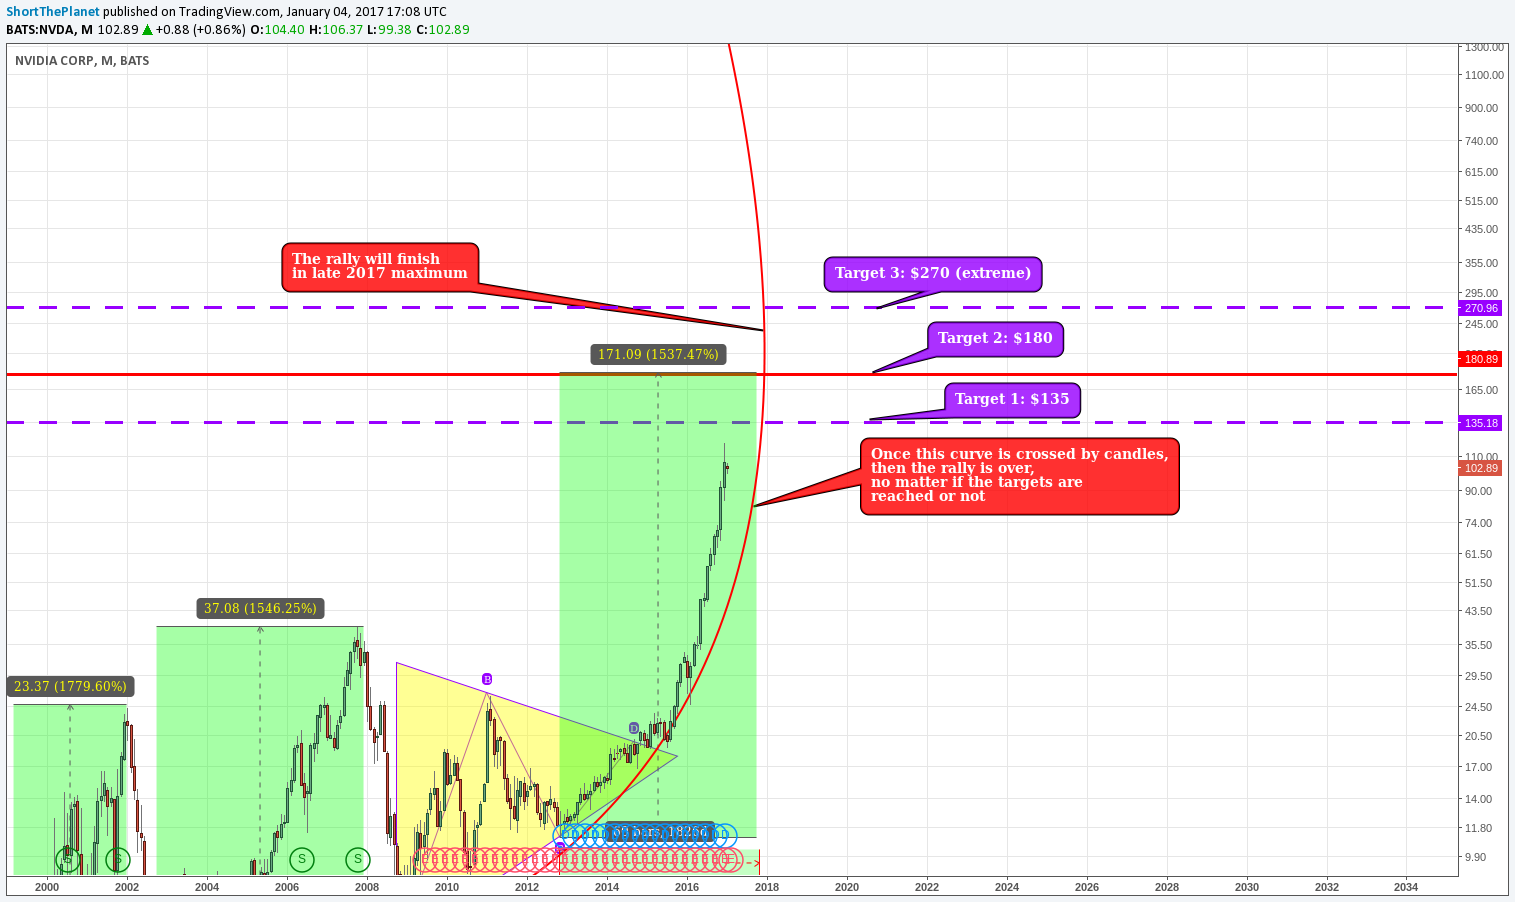
Current price/time targets for NVIDIA
Depending on what price we define as the start of the rally, the possible targets are: $135 (conservative), $180 (realistic) or $270 (extreme). Please note the curve on the chart below: it shows the parabolic rise of the price, and once the price candles cross it, the rally is over. Also, the price can't go straight up to infinity, therefore the curve will be crossed anyway in late 2017 maximum.

