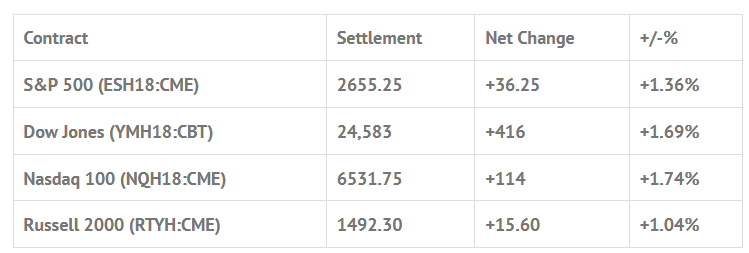
Index Futures Net Changes and Settlements:

Foreign Markets, Fair Value and Volume:
- In Asia 10 out of 11 markets closed higher: Shanghai Comp +1.00%, Hang Seng +1.29%, Nikkei -0.65%
- In Europe 11 out of 12 markets are trading lower: CAC -0.41%, DAX -0.51%, FTSE +0.18%
- Fair Value: S&P -1.64, NASDAQ +2.20, Dow -31.69
- Total Volume: 2.1mil ESH & 1.9k SPH traded in the pit
Today’s Economic Calendar:
NFIB Small Business Optimism Index 6:00 AM ET, Loretta Mester Speaks 8:00 AM ET, and Redbook 8:55 AM ET.
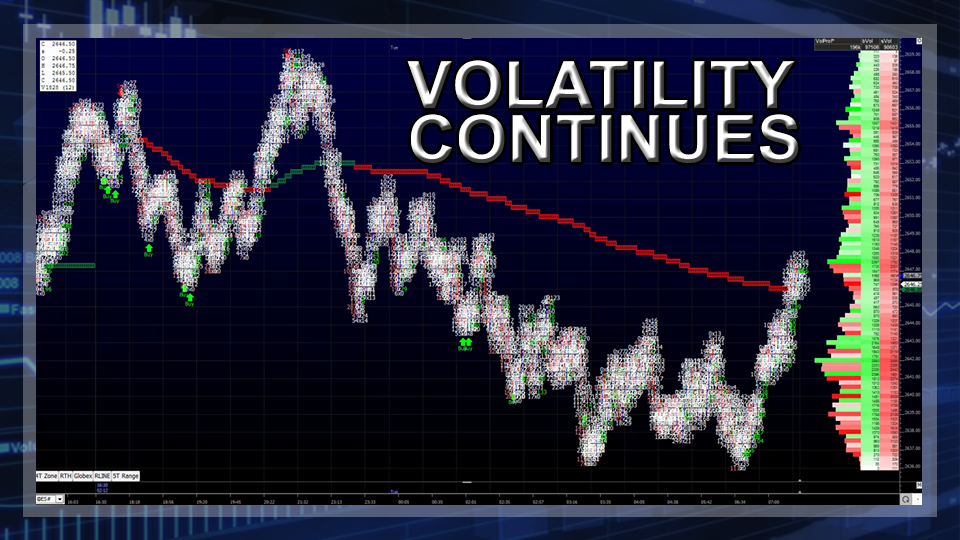
S&P 500 Futures:Looks Good, Smells Bad, #ES Rallies Up To 2671.50 Late And Gets Slammed, MOC Sell $3.2 Billion

Yesterday started out with Asian stocks trading higher, the DAX up 1.5%, and yields on 10-year Treasurys at 2.879%, their highest since January 2014. After closing at 2619.00 last Friday, the S&P 500 futures (ESH18:CME) traded up to 2655.25 on Globex, with overnight volume of 350,000 contracts traded. The ES sold off down to 2626.75 at 8:15, and then traded 2640.00 on the 8:30 open. The first move after the bell was up to 2645.00, before pulling back a few handles and then trading up to 2651.75.
After the early uptick, the ES downticked to 2643.50, and then sold off down to the 2526.00 level, rallied up to a lower high at 2648.00, and then sold off all the way down to the low of the day at 2619.75 around 9:30 CT. The futures then started to stutter step higher, and by 11:20 traded all the way up to new highs at 2661.00. Things calmed down after that, and the ES ‘slowly’ pulled back to the 2650 area and started ‘back and filling’ between the 2650.50 level and the 2656.00 area, and then in came a big by program that pushed the future up to a new high at 2667.50.
Once the high was in, the ES sold off down to 2656.50, and then rallied right back up to the high at 2667.50. There were a few more small pullbacks before trading up to 2668.00. The next move was a quick drop down to 2656.50.
It was constant buy programs all day, mixed in with some small sell programs.
As the MiM went from over $600 million to sell to over $1.3 billion for sale, the ES popped back up to a new high at 2671.50, up 52.5 handles, and then sold off down to 2655.50, had one last push up to 2663.75, and then in a matter of seconds got ‘slammed’ down to 2645.75 on on the 2:45 cash imbalance when the MOC came out sell $3.2 billion. On the 3:00 cash close, the ES traded back up to 2660.00, and then went on to settle at 2654.75, up 33.25 handles, or up +1.33%, on the 3:15 futures close.
Disclaimer: Trading Futures, Options on Futures, and retail off-exchange foreign currency transactions involves substantial risk of loss and is not suitable for all investors. You should carefully consider whether trading is suitable for you in light of your circumstances, knowledge, and financial resources. Any decision to purchase or sell as a result of the opinions expressed in the forum will be the full responsibility of the person(s) authorizing such transaction(s). BE ADVISED TO ALWAYS USE PROTECTIVE STOP LOSSES AND ALLOW FOR SLIPPAGE TO MANAGE YOUR TRADE(S) AS AN INVESTOR COULD LOSE ALL OR MORE THAN THEIR INITIAL INVESTMENT. PAST PERFORMANCE IS NOT INDICATIVE OF FUTURE RESULTS.
