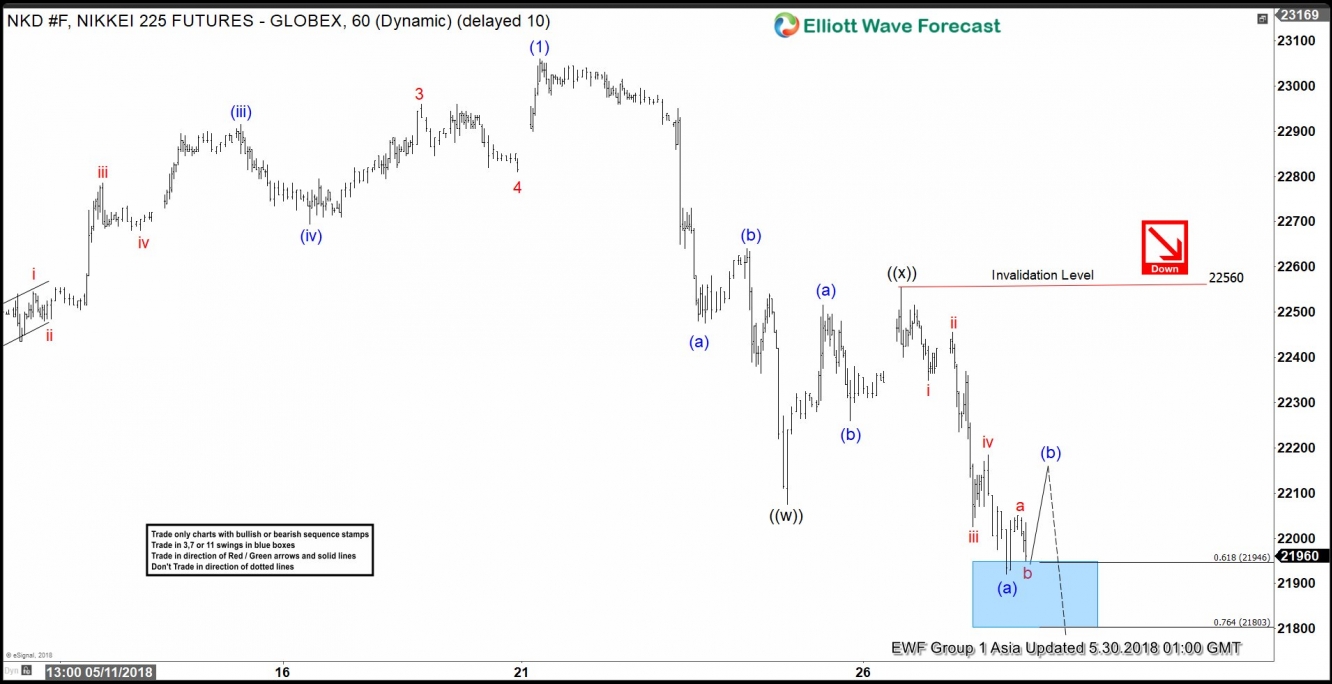
Nikkei short-term Elliott wave view suggests that the rally to 23060 on May 20 high ended Intermediate wave (1) as an impulse. Down from there, the index is pulling back in Intermediate wave (2) pullback to correct cycle from March 23, 2018 low in 3, 7 or 11 swings before the rally resumes. The decline from 23060 high is unfolding as Elliott wave double three structure.
Double three is a 7 swing pattern, which is a combination of two corrective patterns, including Flats, Triangles, Triple three, Zigzag etc. The two corrective patterns combine together to form the double three structure. In the case of Nikkei, the decline from 23060 high to 22075 low ended Minute wave ((w)). The internals of Minute wave ((w)) unfolded as a Zigzag structure where Minutte wave (a) ended at 22475, Minutte wave (b) ended at 22640, and Minutte wave (c) of ((w)) ended at 22075.
From 22075 low, the bounce to 22560 high ended Minute wave ((x)) recovery as zigzag structure. The Index has since made a new low below 22075 and shows 5 swings bearish sequence from May 20 high (23060). Please note that 5 swing sequence is not the same as 5 waves impulse. 5 swing sequence refers to the swing count and refers to 7 swing WXY (double three structure). The 5 swing sequence favors more downside & confirms Minute wave ((y)) lower has started. The internals of Minute wave ((y)) is also unfolding as a Zigzag structure where Minutte wave (a) ended at 21920. Near-term, while bounces fail below 22560 high, expect the Index to see another extension lower towards 21350 – 21579, which is 100%-123.6% Fibonacci extension area of Minute ((w))-((x)). Afterwards, expect the Index to at least see a 3 waves bounce. We don’t like buying the Index.
Nikkei 1 Hour Elliott Wave Chart


