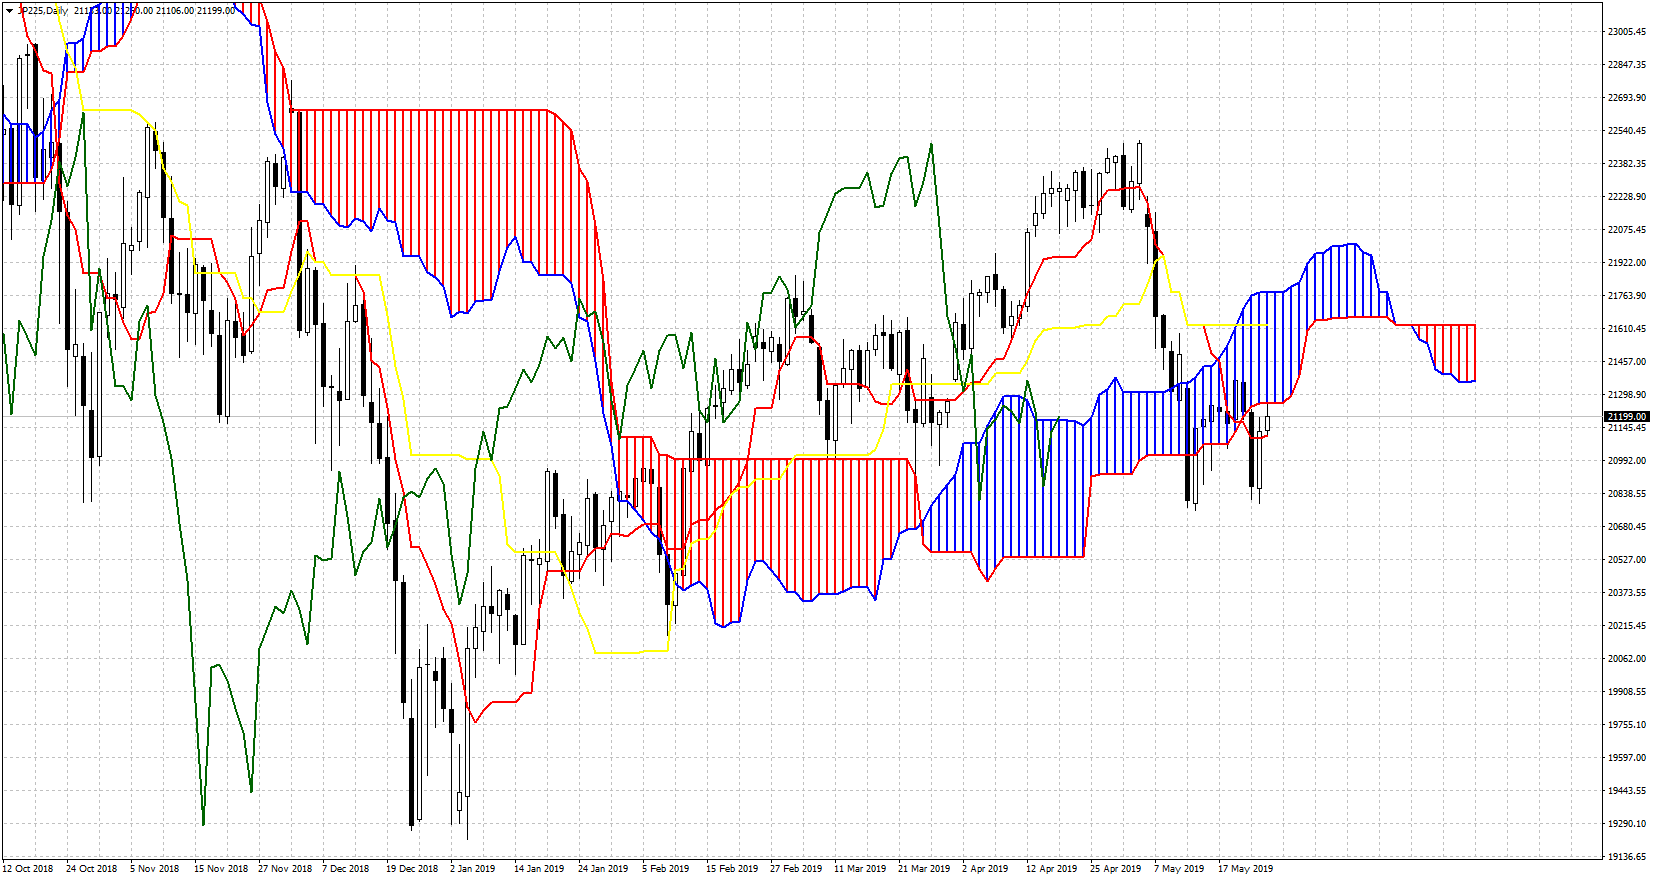
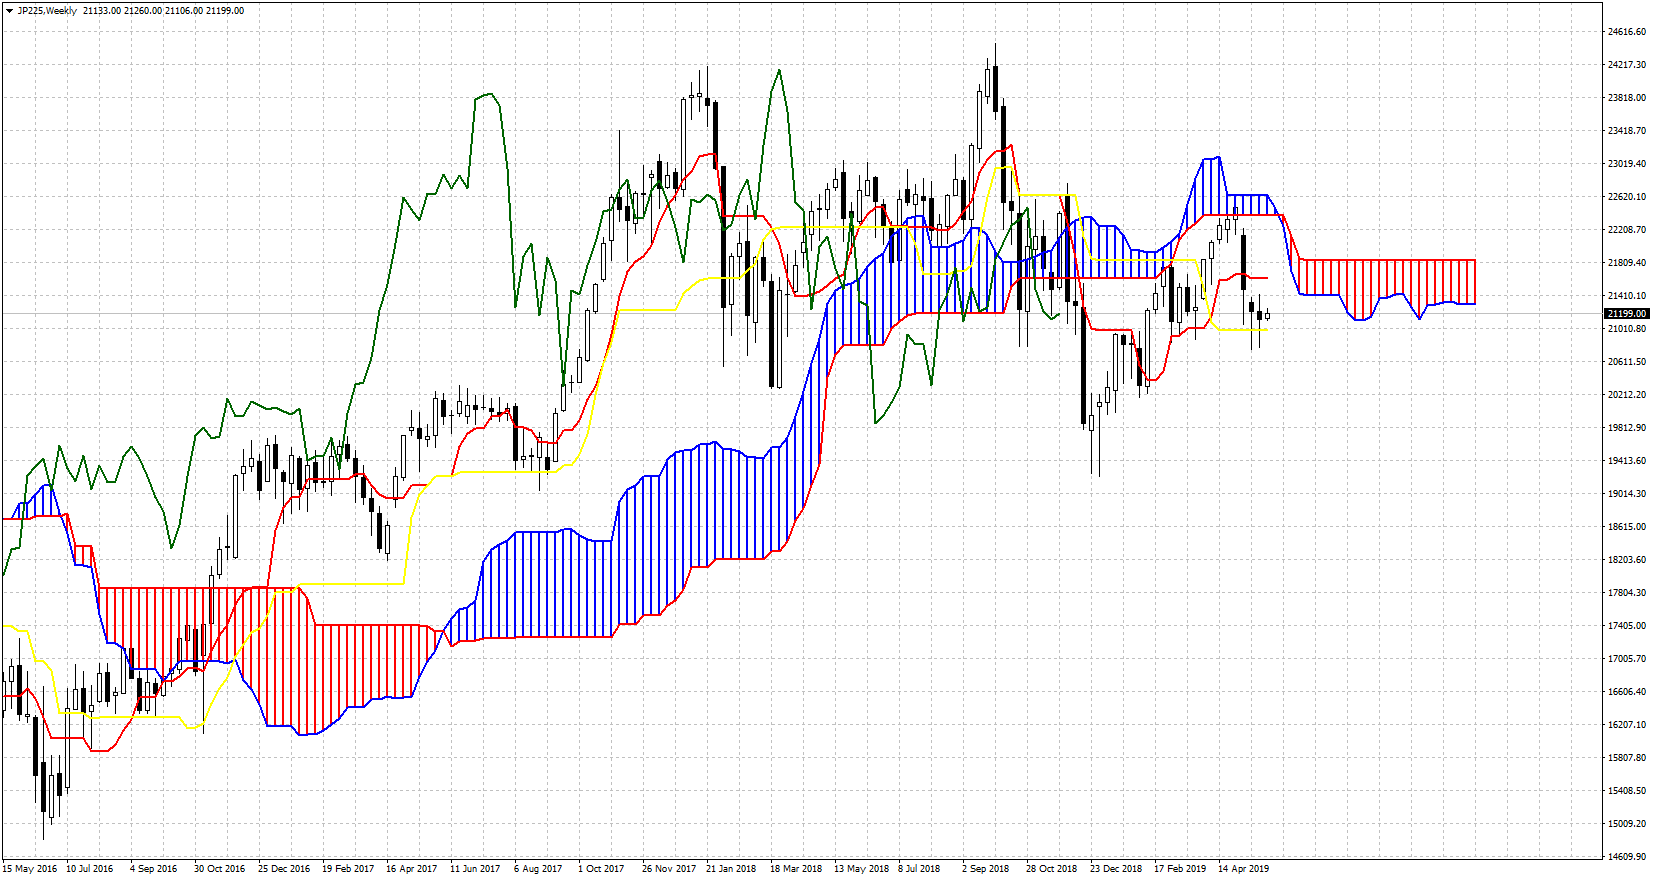
There are two important bearish signs for the chart of Nikkei on the daily and weekly time frame using Ichimoku cloud analysis.
In the Daily chart Nikkei is below the Kumo (CLOUD). This is a bearish sign. Bulls tried to push price back inside but got rejected and the price fell back below the cloud. Bulls are now trying again to get inside the cloud and then above it. However, it seems that we are going to see another rejection. A rejection on a daily basis would be a bearish sign.

Support at 20800 is key and a break below it will be a bearish sign. On a weekly basis, we saw a rejection at the cloud resistance while price remains below the weekly cloud.

Trading below the cloud is a bearish sign. However, the price seems to be supported around 21000 price level. A weekly close below the kijun-sen (yellow line indicator) at 21000 would be a bearish sign that would imply more selling pressure should come soon.
In both daily and weekly time frames, Ichimoku clouds are bearish for NIKKEI. For this to change we need to see at least price break above 21800 which is the upper cloud boundary on a daily basis.
Disclosure: None of the information or opinions expressed in this blog constitutes a solicitation for the purchase or sale of any security or other instrument. Nothing in this article constitutes investment advice and any recommendations that June be contained herein have not been based upon a consideration of the investment objectives, financial situation or particular needs of any specific recipient. Any purchase or sale activity in any securities or other instrument should be based upon your own analysis and conclusions.
