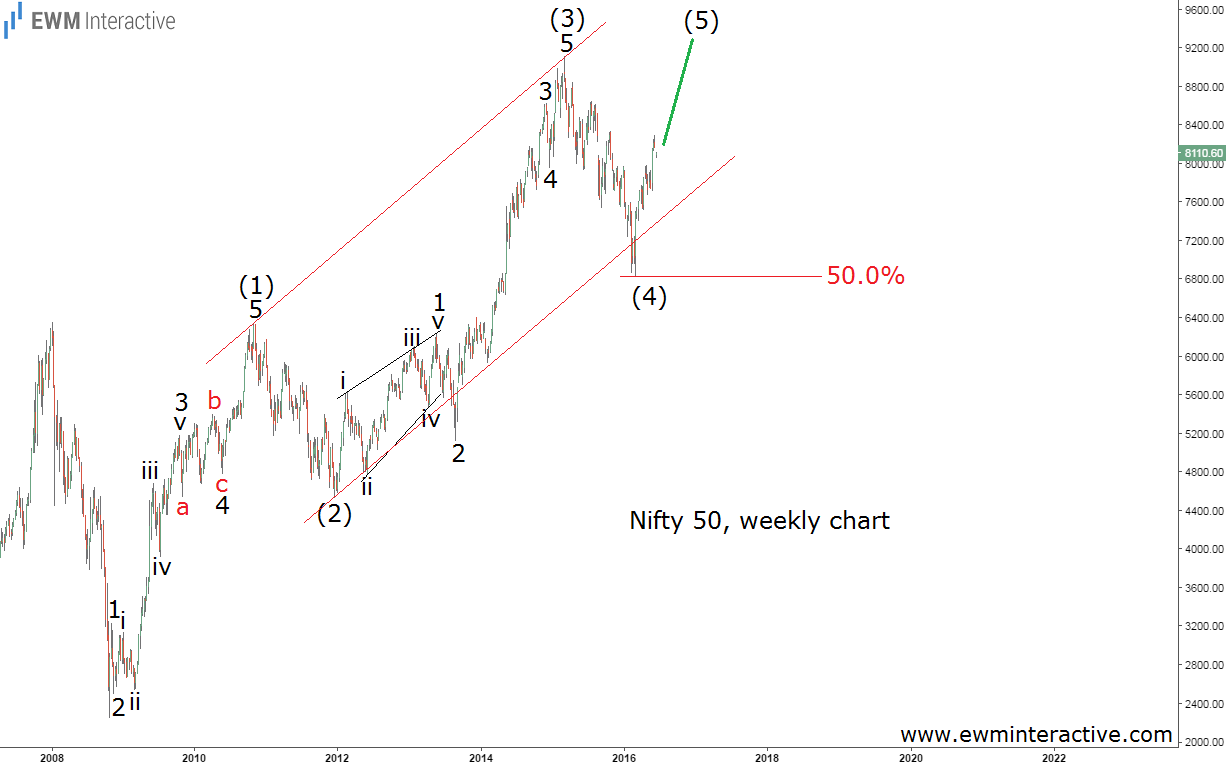
For the Nifty 50, the Great Recession ended in October 2008, when the index bottomed at 2253. Since then, prices have been rising until March 2015, when 9119 was reached. But the bulls could not keep that momentum, which led to a decline to 6825 by late-February 2016. Currently, it is hovering around 8110, but none of these figures will tell us what to expect from now on. So, the real question is how to interpret them, in order to find clues of the market’s future intentions. To do that, we need to see where do these numbers fit into a price chart and what the Elliott Wave Principle has to say about it then. Elliott Wave analysis gives best results, when we start from the biggest time frame and go down to the smaller ones. The weekly chart of Nifty 50 is given below.
The weekly chart shows the entire development since the bottom in October 2008. As visible, it cannot be counted as a five-wave impulse, at least not yet. In our opinion, that is because the pattern is still in progress. It looks like waves (1) through (4) have been completed and wave (5) to the upside is currently in progress. Apart from the count, we see three other reasons to be bullish on Nifty 50. First, according to the theory, the first and the fourth waves within an impulsive sequence should not overlap in price. As visible, wave (4) fell to 6825 and then jumped back up, which is higher than the termination point of wave (1) at 6338. Second, the post-9119 weakness, marked as wave (4), seems to have ended precisely at the 50% Fibonacci retracement level of wave (3). And third, impulses tend to develop between the parallel lines of a trend channel. Nifty 50’s trend seems to abide by this guideline, since wave (4) slightly breached the lower line of the channel, but quickly returned back in it. That is about all the information we can extract from the weekly chart of Nifty 50 and it suggests the larger uptrend has resumed and the index is poised for new highs above 9119 in the long term. Now let’s take a look at the sub-structure of wave (4) on a 4-hour chart, to see if wave (4) is really over.
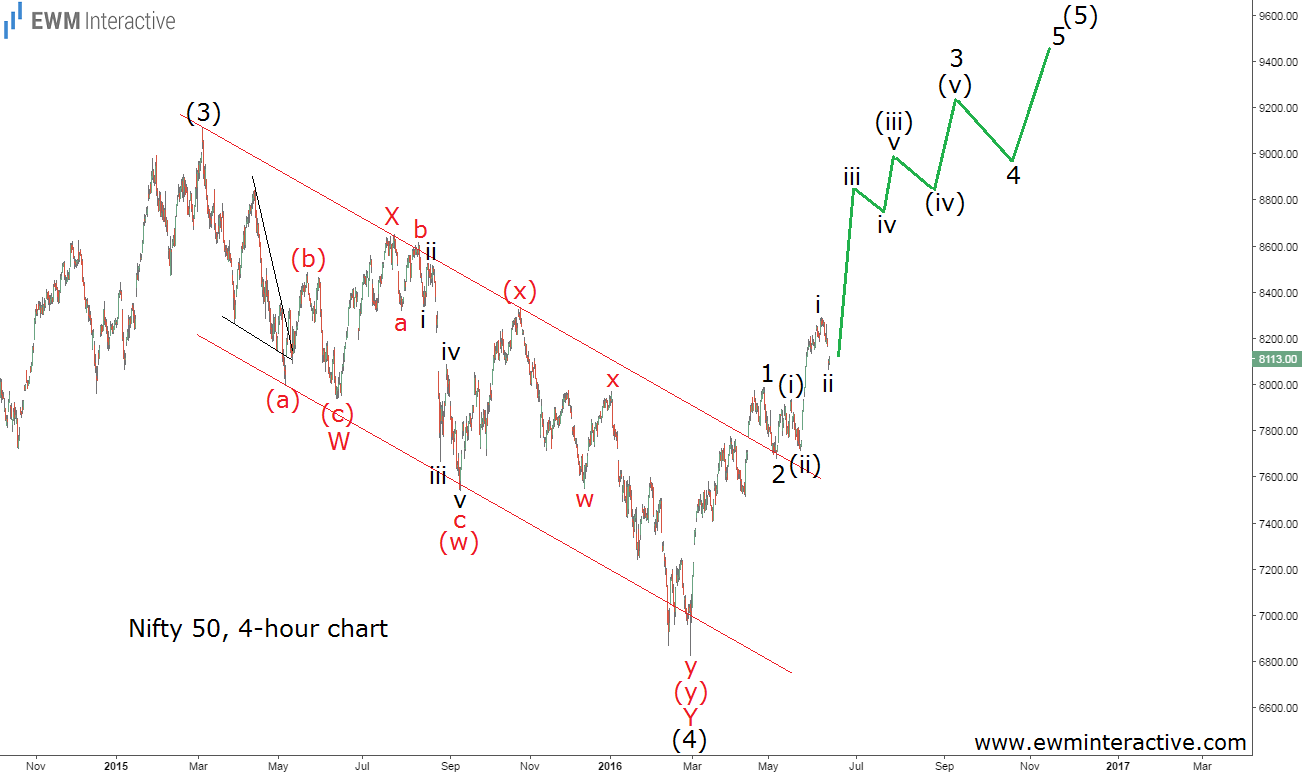
It appears it is. Wave (4) looks like a complete W-X-Y double zig-zag. An (a)-(b)-(c) simple zig-zag in wave W, where wave (a) is a leading diagonal, followed by a smaller (w)-(x)-(y) in wave Y with an intervening wave X in between. Wave y of (y) of Y completes the entire corrective sequence and gives the start of a new rally to 8295 so far. We believe the most recent advance from 6825 to 8295 is the start of wave (5) to the north. In addition to the count, pay attention to the fact that wave (4) has been developing within a corrective channel, whose upper line has just been broken by the bulls. It appears this resistance was successfully turned into support, which further confirms the positive outlook. If this is the correct count, the recovery from 6825 should extend into a larger five-wave impulse in wave (5). In conclusion, Nifty 50’s weekly uptrend seems to have resumed and new all-time highs could be expected in the long term. Nifty 50 bulls seem to be aiming for the top.
- English (UK)
- English (India)
- English (Canada)
- English (Australia)
- English (South Africa)
- English (Philippines)
- English (Nigeria)
- Deutsch
- Español (España)
- Español (México)
- Français
- Italiano
- Nederlands
- Português (Portugal)
- Polski
- Português (Brasil)
- Русский
- Türkçe
- العربية
- Ελληνικά
- Svenska
- Suomi
- עברית
- 日本語
- 한국어
- 简体中文
- 繁體中文
- Bahasa Indonesia
- Bahasa Melayu
- ไทย
- Tiếng Việt
- हिंदी
Nifty 50 Aiming For The Top
Latest comments
Loading next article…
Install Our App
Risk Disclosure: Trading in financial instruments and/or cryptocurrencies involves high risks including the risk of losing some, or all, of your investment amount, and may not be suitable for all investors. Prices of cryptocurrencies are extremely volatile and may be affected by external factors such as financial, regulatory or political events. Trading on margin increases the financial risks.
Before deciding to trade in financial instrument or cryptocurrencies you should be fully informed of the risks and costs associated with trading the financial markets, carefully consider your investment objectives, level of experience, and risk appetite, and seek professional advice where needed.
Fusion Media would like to remind you that the data contained in this website is not necessarily real-time nor accurate. The data and prices on the website are not necessarily provided by any market or exchange, but may be provided by market makers, and so prices may not be accurate and may differ from the actual price at any given market, meaning prices are indicative and not appropriate for trading purposes. Fusion Media and any provider of the data contained in this website will not accept liability for any loss or damage as a result of your trading, or your reliance on the information contained within this website.
It is prohibited to use, store, reproduce, display, modify, transmit or distribute the data contained in this website without the explicit prior written permission of Fusion Media and/or the data provider. All intellectual property rights are reserved by the providers and/or the exchange providing the data contained in this website.
Fusion Media may be compensated by the advertisers that appear on the website, based on your interaction with the advertisements or advertisers.
© 2007-2025 - Fusion Media Limited. All Rights Reserved.
