Earnings Preview For Utilities Powerhouse NextEra Energy

Published 07/19/2020, 12:11 AM
Updated 07/09/2023, 06:31 AM
US500
-
NEE
-
XLU
-

NextEra Energy (NYSE:NEE) reports earnings this coming Friday before the market open. It’s the biggest stock, by far, in the utilities sector with a market cap of $135 (the next highest is just $80 billion). All eyes will be on the data. In terms of price action, the stock has come full-circle from its 52-week highs touched earlier this year before the COVID-19 crash.
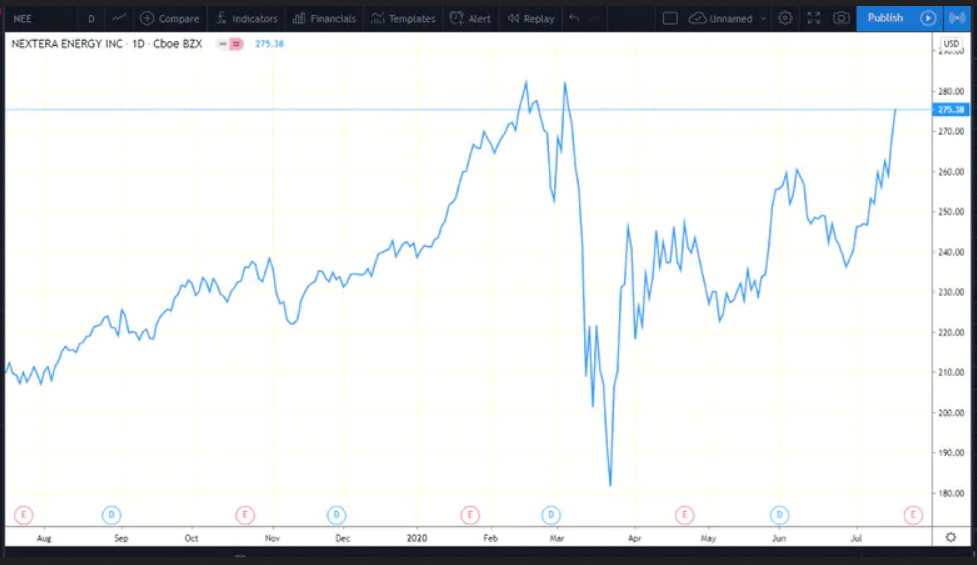
NEXTRA Energy Inc Daily Chart

Source: StockCharts

The stock was above $280, then fell hard to $170 during late March. But here we are – back near the all-time high as an impressive rebound was confirmed on Friday with a 3% advance. NextEra closed at $275.38 in advance of next week’s earnings report.

Taking a step back and a broader look, it’s been a rough earnings season already but also an okay one so far. How can that be?

Well, earnings are set to plummet 44% for the second quarter according to FactSet – the worst since the dreaded fourth quarter of 2008 when S&P 500 earnings fell 69%. Yet the beat-rate, or how corporate earnings per share verifies relative to analyst expectations, is 73% so far - a bit better than the 5-year average. Revenues beats have been even stronger relative to analyst expectations.

Utilities don’t start reporting in earnest until this coming week though, so they have a lot to prove. Expectations are not low either. The market anticipates the utilities sector to have an earnings decline of 0.6% year over year – the best (least bad) among the 11 market sectors.

The market will look to see how COVID-19 impacted sales at NextEra. Was power demand exceptionally soft across the Southeast region? Were renewables deals on the decline? How is the economic outlook according to the company’s managers? These are just some of the key questions we hope to have more color on by the end of the week.

NextEra has a strong track record. Adjusted earnings per share have increased at a rate of 8.4% per year since 2004 while dividends per share have a CAGR of 9.4% in that time. Can they keep it up?

Latest comments

Loading next article…
Risk Disclosure: Trading in financial instruments and/or cryptocurrencies involves high risks including the risk of losing some, or all, of your investment amount, and may not be suitable for all investors. Prices of cryptocurrencies are extremely volatile and may be affected by external factors such as financial, regulatory or political events. Trading on margin increases the financial risks.
Before deciding to trade in financial instrument or cryptocurrencies you should be fully informed of the risks and costs associated with trading the financial markets, carefully consider your investment objectives, level of experience, and risk appetite, and seek professional advice where needed.
Fusion Media would like to remind you that the data contained in this website is not necessarily real-time nor accurate. The data and prices on the website are not necessarily provided by any market or exchange, but may be provided by market makers, and so prices may not be accurate and may differ from the actual price at any given market, meaning prices are indicative and not appropriate for trading purposes. Fusion Media and any provider of the data contained in this website will not accept liability for any loss or damage as a result of your trading, or your reliance on the information contained within this website.
It is prohibited to use, store, reproduce, display, modify, transmit or distribute the data contained in this website without the explicit prior written permission of Fusion Media and/or the data provider. All intellectual property rights are reserved by the providers and/or the exchange providing the data contained in this website.
Fusion Media may be compensated by the advertisers that appear on the website, based on your interaction with the advertisements or advertisers.
© 2007-2025 - Fusion Media Limited. All Rights Reserved.