
Gold mining giant Newmont Mining Corporation (NYSE:NEM) logged net loss from continuing operations of $534 million or 99 cents per share in fourth-quarter 2017, wider than net loss of $391 million or 73 cents recorded a year ago.
Barring one-time items, adjusted earnings were 40 cents per share for the quarter, which came in line with the Zacks Consensus Estimate.
Newmont reported revenues of $1,935 million, up around 8.2% year over year. The figure missed the Zacks Consensus Estimate of $1,957.6 million.
Full-Year 2017 Results
For 2017, Newmont reported adjusted net income of $780 million or $1.46 per share compared with $619 million or $1.16 per share in 2016.
Revenues jumped roughly 9.5% year over year to $7,348 million.
Newmont Mining Corporation Price, Consensus and EPS Surprise
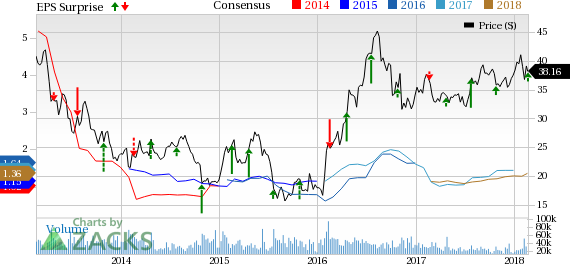
Newmont Mining Corporation Price, Consensus and EPS Surprise | Newmont Mining Corporation Quote
Operational Highlights
Newmont's attributable gold production increased roughly 1% year over year to 1.34 million ounces in the quarter.
Average net realized gold price increased 6% to $1,270 per ounce from $1,193 an ounce a year ago. The average net realized copper price jumped 29% to $3.20 per pound from $2.49.
Newmont’s costs applicable to sales (CAS) for gold was $693 per ounce in the quarter, up roughly 2% from year-ago quarter figure of $681. Copper CAS was $1.62 per pound, down 14% year over year.
All-in sustaining costs (AISC) for gold rose roughly 5% year over year to $968 per ounce.
Regional Performance
North America
Attributable gold production in North America in the fourth quarter was 556,000 ounces, rising 1% year over year. Consolidated copper production was at 3000 tons, down 25% from 4,000 tons recorded in the year-ago quarter.
Gold CAS for the region was $720 per ounce compared with $721 in the year-ago quarter. Copper CAS was $1.84 per pound, declining 25% year over year.
South America
Attributable gold production in South America was 188,000 ounces, rising 13% year over year. Gold CAS for the region fell 9% to $577 per ounce.
Australia
Attributable gold and copper production in the region was 406,000 ounces, up 3% year over year. Gold CAS and copper CAS for this region was $710 per ounce, up 11%, and $1.57 per pound, down 7%, respectively.
Africa
The region produced 191,000 ounces of gold in the reported quarter, down 9% year over year. Gold CAS was $755 per ounce, decreasing 2%.
Financial Position
Net cash provided by continuing operating activities improved 22.2% year over year to $2,350 million in 2017. The company ended the year with $3.3 billion cash in hand and also reduced net debt by over 83% to $0.8 billion.
Outlook
Newmont expects attributable gold production in the range of 4.9-5.4 million ounces for 2018 and 2019 factoring in full potential mine plan, recovery improvements and throughput.
The company expects its AISC for 2018 to be between $965 and $1,025 per ounce. Gold CAS is expected between $700 and $750 per ounce.
The company’s attributable copper production forecast for 2018 remains in the range of 40,000-60,000 tons.
For 2018, Copper CAS is expected in the range of $1.65-$1.85 per pound and copper AISC is projected to be between $2 and $2.20 per pound.
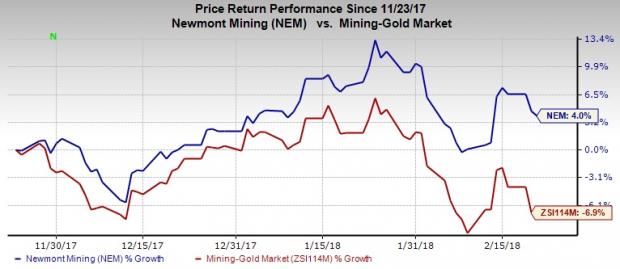
Price Performance
Newmont’s shares have moved up 4% over the last three months, outperforming 6.9% decline recorded by its industry.
Zacks Rank & Key Picks
Newmont currently carries a Zacks Rank #3 (Hold).
Some better-ranked stocks in the basic materials space are Steel Dynamics, Inc. (NASDAQ:STLD) , The Mosaic Company (NYSE:MOS) and United States Steel Corporation (NYSE:X) , each sporting a Zacks Rank #1 (Strong Buy). You can see the complete list of today’s Zacks #1 Rank stocks here.
Steel Dynamics has an expected long-term earnings growth rate of 12%. Its shares have soared 39.9% over the last six months.
Mosaic has an expected long-term earnings growth rate of 9.5%. Its shares have moved up 36.1% over the past six months.
U.S. Steel has an expected long-term earnings growth rate of 8%. Its shares have rallied 72.2% over the last six months.
More Stock News: This Is Bigger than the iPhone!
It could become the mother of all technological revolutions. Apple (NASDAQ:AAPL) sold a mere 1 billion iPhones in 10 years but a new breakthrough is expected to generate more than 27 billion devices in just 3 years, creating a $1.7 trillion market.
Zacks has just released a Special Report that spotlights this fast-emerging phenomenon and 6 tickers for taking advantage of it. If you don't buy now, you may kick yourself in 2020.
Click here for the 6 trades >>
The Mosaic Company (MOS): Free Stock Analysis Report
Newmont Mining Corporation (NEM): Free Stock Analysis Report
Steel Dynamics, Inc. (STLD): Free Stock Analysis Report
United States Steel Corporation (X): Free Stock Analysis Report
Original post