- Market Year-End Wrap Up
- New Year’s Investor Resolutions
- Sector Analysis
- 401k Plan Manager
- American race relations reached their lowest point since … OK, since 2015.
- We learned that the Russians are more involved in our election process than the League of Women Voters.
- For much of the year the economy continued to struggle, with the only growth sector being people paying insane prices for tickets to “Hamilton.”
- In a fad even stupider than “planking,” millions of people wasted millions of hours, and sometimes risked their lives, trying to capture imaginary Pokémon Go things on their phones, hoping to obtain the ultimate prize: a whole bunch of imaginary Pokémon Go things on their phones.
- A major new threat to American communities — receiving at least as much coverage as global climate change —emerged in the form of: Clowns.
- In a shocking development that caused us to question our most fundamental values, Angelina and Brad broke up even though they are both physically attractive.
- We continued to prove, as a nation, that no matter how many times we are reminded, we are too stupid to remember to hold our phones horizontally when we make videos.
- Musically, we lost Prince, David Bowie, Leonard Cohen, George Michael and Debbie Reynolds; we gained the suicide-inducing TV commercial in which Jon Bon Jovi screeches about turning back time.
- 50% – of Americans are ecstatic over the election of Donald Trump.
- 12% – is the increase of the S&P 500 index including dividends.
- 7.6% – is the increase of a 60/40 stock/bond portfolio.
- 45% – was the increase in oil prices which came as a big relief to producers.
- 4.6% – unemployment
- 2%ish – the economy continues to plug along
- 4% – rise in the U.S. dollar
- 7.5% – increase in rates despite all the against over the rise.
- You wake up – which means you are still alive.
- You’re hungry – which means all your systems are functioning normally.
- There is a knob your side of the door – which means you have your freedom.”
- Markets pushing historic levels of extreme overbought conditions,
- 2nd highest levels of valuation on record,
- Extreme deviations from long-term growth trend lines,
- Investor sentiment and confidence pushing extreme bullishness,
- Investors fully committed to the market with low levels of cash, and;
- High levels of leverage in terms of margin debt and corporate debt.
- I will do more of what is working and less of what isn’t.
- I will remember that the “Trend Is My Friend.”
- I will be either bullish or bearish, but not “piggish.” (Pigs get slaughtered)
- I will remember it is “Okay” to pay taxes.
- I will maximize profits by staging my buys, working my orders and getting the best price.
- I will look to buy damaged opportunities, not damaged investments.
- I will diversify to control my risk.
- I will control my risk by always having pre-determined sell levels and stop-losses.
- I will do my homework. I will do my homework. I will do my homework.
- I will not allow panic to influence my buy/sell decisions.
- I will remember that “cash” is for winners.
- I will expect, but not fear, corrections.
- I will expect to be wrong and I will correct errors quickly.
- I will check “hope” at the door.
- I will be flexible.
- I will have the patience to allow my discipline and strategy to work.
- I will turn off the television, put down the newspaper, and focus on my own analysis.
- Markets always revert to the mean.
- Excesses in one direction always lead to excesses in the other.
- There are no new eras and excesses are never permanent.
- Exponentially rising/falling markets go further than logic would expect.
- Markets do not correct excesses by going sideways.
- The public buys the most at the top and least at the bottoms.
- Fear and greed are stronger than long-term resolve.
- Markets are strongest when they are broad and weakest when they are narrow.
- Bull and bear markets have three stages. Both end with capitulation.
- When all experts agree, something else will happen.
- Bull markets are more fun their bear markets.
- Tighten up stop-loss levels to current support levels for each position.
- Hedge portfolios against major market declines.
- Take profits in positions that have been big winners
- Sell laggards and losers
- Raise cash and rebalance portfolios to target weightings.
- Determine areas requiring new or increased exposure.
- Determine how many shares need to be purchased to fill allocation requirements.
- Determine cash requirements to make purchases.
- Re-examine portfolio to rebalance and raise sufficient cash for requirements.
- Determine entry price levels for each new position.
- Determine “stop loss” levels for each position.
- Determine “sell/profit taking” levels for each position.
Dave Barry summed up 2016 pretty well:
“It wasn’t just bad. It was the Worst. Election. Ever.
And that was only one of the reasons why 2016 should never have happened. Here are some others:
Did anything good happen in 2016? Let us think …
OK, the “man bun” appeared to be going away.
That was pretty much it for the good things.”
Of course, there were indeed some other good things that happened in 2016 in percentages:
As my good friend, City Councilman Mike Knox, always says:
“There are three things you should be thankful for every day:
So, as we enter into 2017, I will tell you now I have no clue as to what to expect in this coming year. We can make lot’s of guesses and some will turn out to be true and some won’t. That is just the probability of “guessing” at anything.
So, I will just wish you health, happiness, success and prosperity in 2017. I also want you to be thankful that you wake up each day hungry and have freedom with which to enjoy your family, loved ones, and all the good things life has to offer.
And remember, all we can do is:
“Accept the things that we cannot change. Change the things we cannot accept.”
Happy New Year.
Best Thing You Will Watch This Weekend
If you want to understand the challenges Millennial children are growing up with then watch this video. Simon Sinek explains the Millennial’s generation addictions and shortcomings to the world we live in.
Short Market Note & Review
We wrapped up 2016 with a fairly dismal trading week as the S&P had its biggest plunge since the election diving 24.95 points or 1.10%. This has left the bulls pondering if they will ever be able to recover from such a catastrophe. (Dripping with sarcasm)
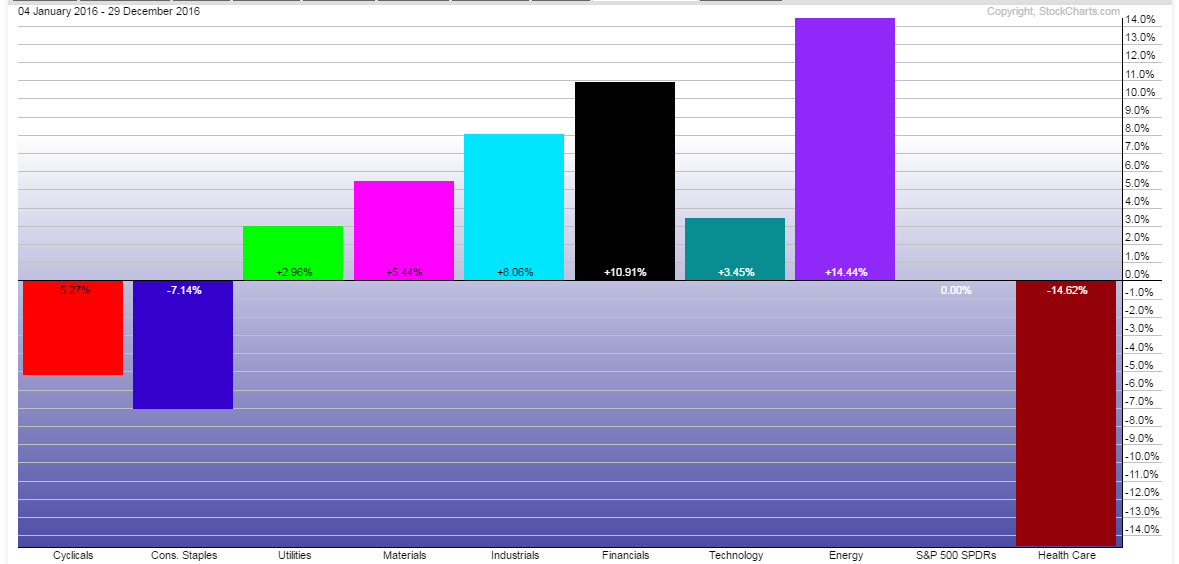
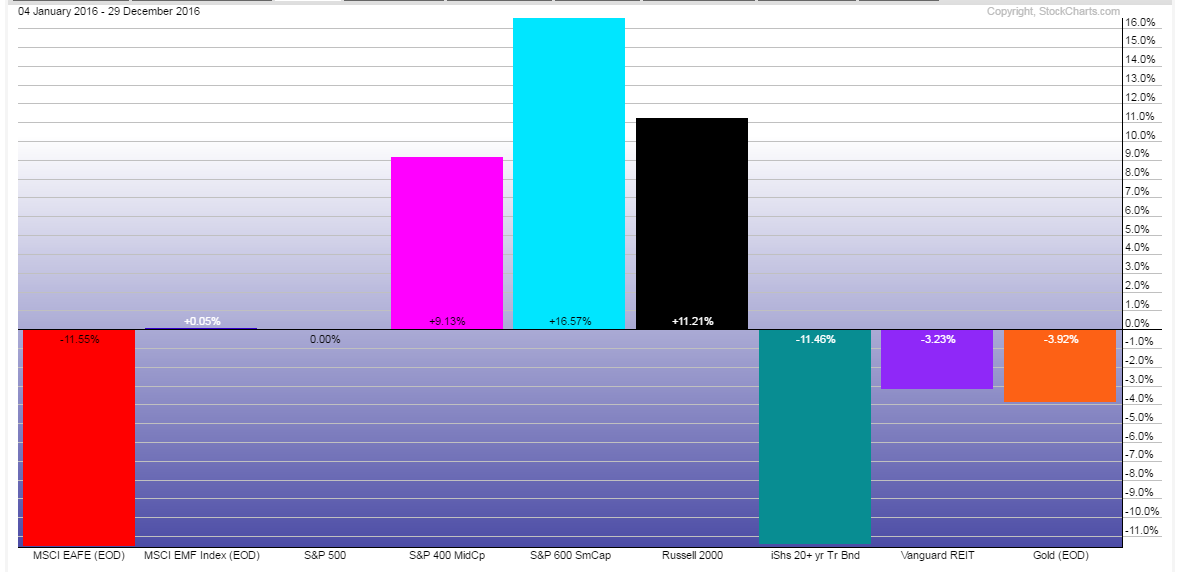
However, for the year, all of the gains of the S&P 500 came in just the last two months of the year and those gains were somewhat relegated to only a few areas of the market. The two charts below show returns by sector, and by major market, as compared to the S&P 500 for the year.
S&P 500 Sector Returns Vs. S&P 500
Major Index Returns Vs. S&P 500
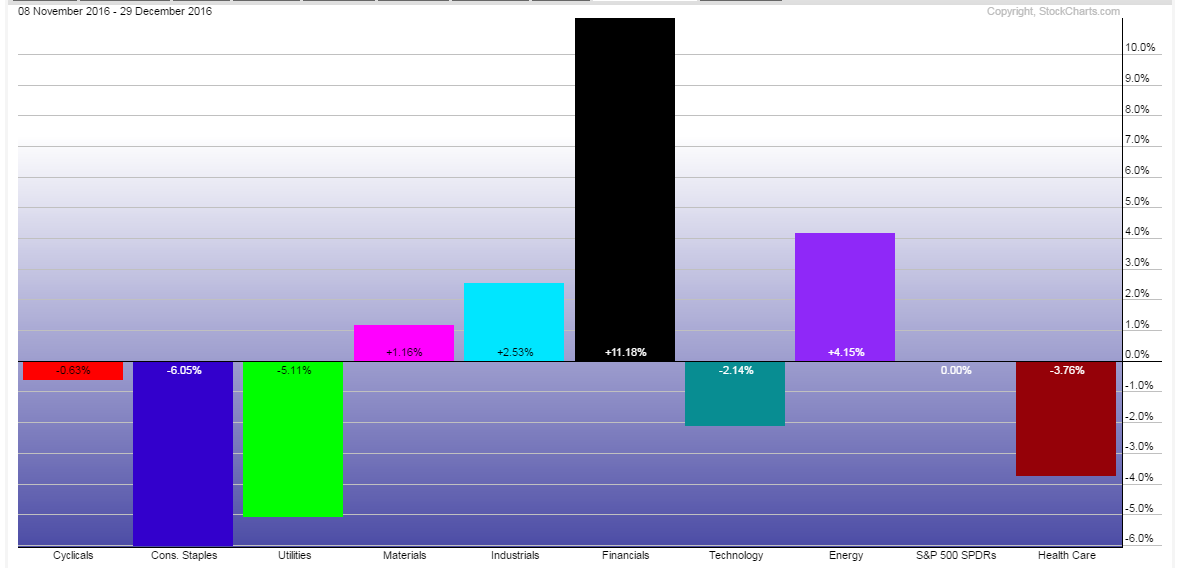
Now, take a look at the gains above for the entire year as compared to the charts below which show comparative returns since the November 8th election.
S&P 500 Sector Returns Vs. S&P 500 since November 8th
Major Index Returns Vs. S&P 500 since November 8th
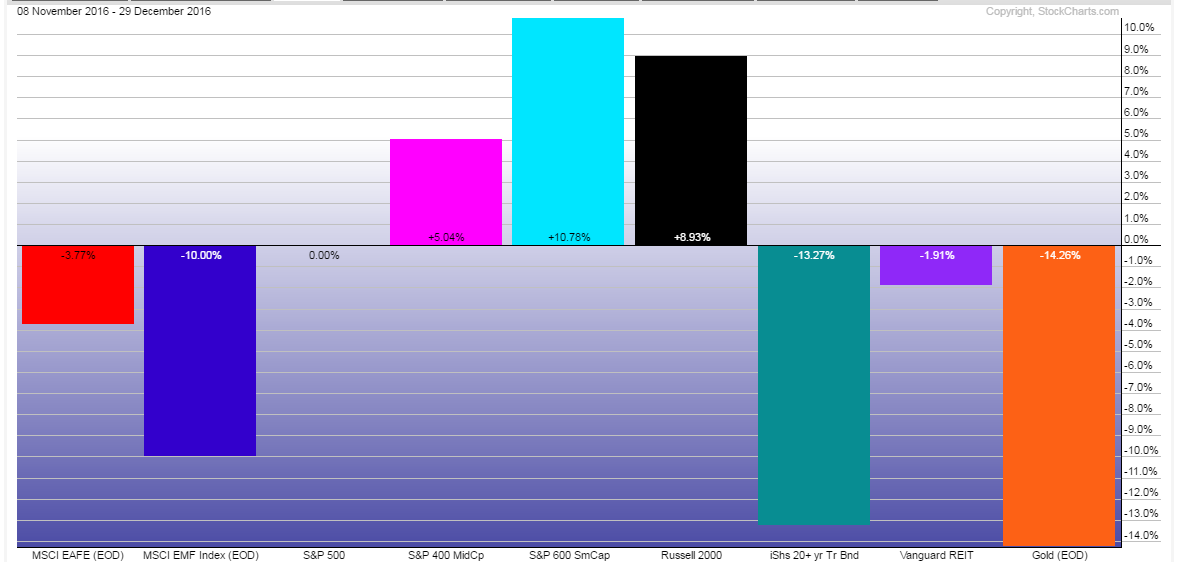
As you can see, the bulk of the returns for the S&P 500 came from the massive explosion of the heavily weighted sector of financial related companies since the election. Furthermore, if you were invested anywhere other than domestically (large, mid and small capitalization stocks) you underperformed the S&P 500 this year.
You will hear a lot heading into the New Year about fund managers once again underperforming the S&P 500 index and why you should just buy an index and go home.
Unfortunately, the majority of those individuals touting such nonsense don’t, and never have in many instances, actually managed money for individuals or institutions. The reason you know this to be the case is they are they same ones touting the benefits of “diversification.”
If you were diversified this year, you underperformed. Period.
However, as I have written extensively about in past articles (see here, here and here), beating some random benchmark index is the worst thing you can do long-term for your money. As I noted:
“But it gets worse. Often times, these comparisons are made without even considering the right way to quantify ‘risk’. That is, we don’t even see measurements of risk-adjusted returns in these ‘performance’ reviews. Of course, that misses the whole point of implementing a strategy that is different than a long-only index.
It’s fine to compare things to a benchmark. In fact, it’s helpful in a lot of cases. But we need to careful about how we go about doing it.”
It is highly unlikely that you will ever “beat the market” over the long-term anyway.
“While Wall Street wants you to compare your portfolio to the “index” so that you will continue to keep money in motion, which creates fees for Wall Street, the reality is that you can NEVER beat a “benchmark index” over a long period. This is due to the following reasons:
1) The index contains no cash
2) It has no life expectancy requirements – but you do.
3) It does not have to compensate for distributions to meet living requirements – but you do.
4) It requires you to take on excess risk (potential for loss) in order to obtain equivalent performance – this is fine on the way up, but not on the way down.
5) It has no taxes, costs or other expenses associated with it – but you do.
6) It has the ability to substitute at no penalty – but you don’t.
7) It benefits from share buybacks – but you don’t.”
For all of these reasons, and more, the act of comparing your portfolio to that of a “benchmark index” will ultimately lead you to taking on too much risk and into making emotionally based investment decisions. The index is a mythical creature, like the Unicorn, and chasing it takes your focus off of what is most important – your money and your specific goals.
Investing is not a competition and, as history shows, there are horrid consequences for treating it as such. So, do yourself a favor and forget about what the benchmark index does from one day to the next. Focus instead on matching your portfolio to your own personal goals, objectives, and time frames.
In the long run, you may not beat the index, but you are likely to achieve your own personal investment goals which is why you invested in the first place.
The Only Chart That Matters Heading Into 2017
As we head into 2017 we enter into the year with:
In other words, after 8 straight years of a bull market advance, what is the risk you are taking to garner additional returns?
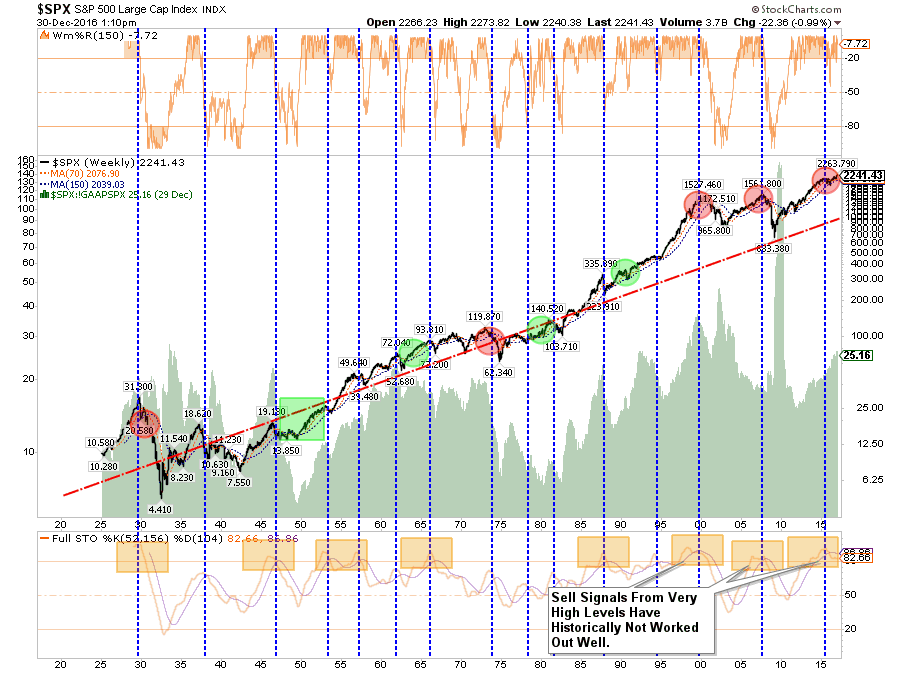
With markets pushing overbought, overvalued, and bullish extremes the future outcomes have not been terrific.
Just something to think about.
Investor Resolutions For 2017
Here are my annual resolutions for the coming year to be a better investor/portfolio manager:
These are the same resolutions I attempt to follow every year. There is no shortcut to being a successful investor. There are only the basic rules, discipline and focus that is required to succeed long-term.
The biggest problem for investors is the bull market itself.
When the “bull is running” we believe we are smarter and better than we actually are. We take on substantially more risk than we realize as we continue to chase market returns and allow “greed” to displace our rational logic. Just as with gambling, success breeds overconfidence as the rising tide disguises our investment mistakes.
Unfortunately, it is during the subsequent completion of the full-market cycle that our errors are revealed. Always too painfully and tragically as the loss of capital exceeds our capability to “hold on for the long-term.”
Remembering these basic rules from Bob Farrell will help you survive, and win, the long-term investment game.
Happy New Year
#PortfolioHedgesMatter
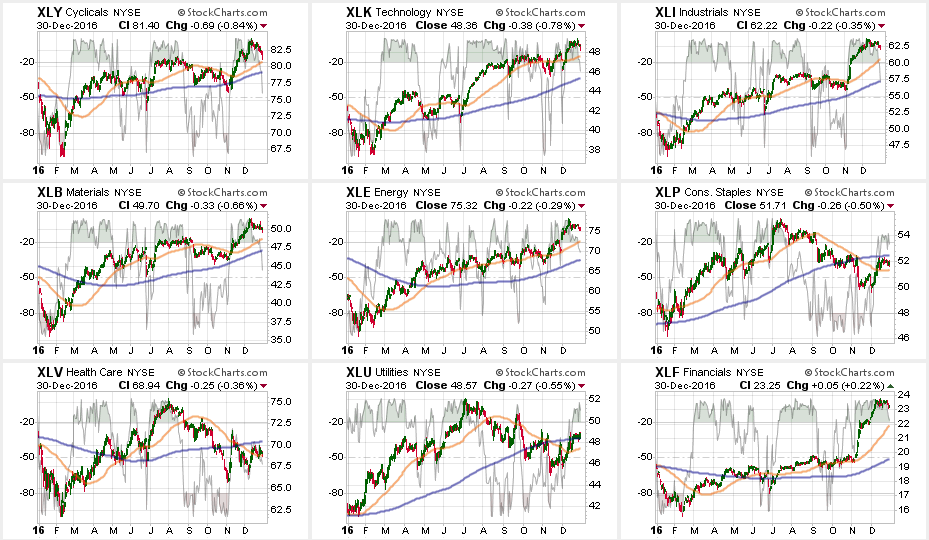
Market & Sector Analysis
Data Analysis Of The Market & Sectors For Traders
S&P 500 Tear Sheet
Thank you for your recent suggestions, while not all requests are possible to fulfill due to data limitations, I do appreciate the input.
Update: As requested, I have added price momentum analysis for S&P 500, 400, & 600 indices.
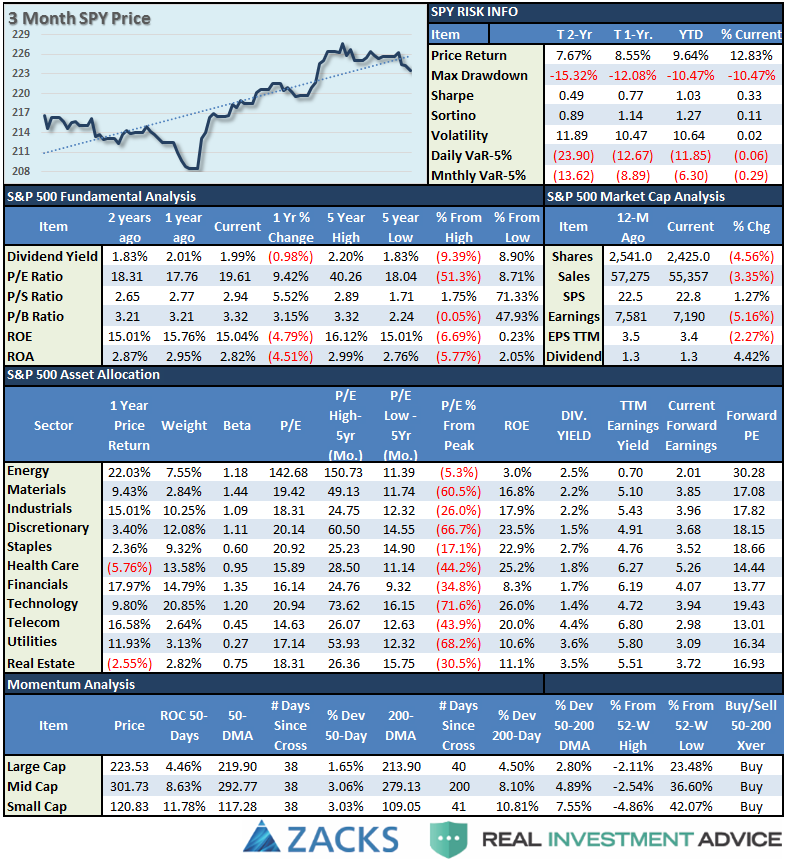
Sector Analysis
Comments
For a second week running, the market struggled but, as opposed to last week’s 1.46 point plunge, the market rocketed higher by 3.5 points to finish the week up 0.15%. (#sarcasm alert). Financials continued to lead the charge the last week, and remain extremely overbought. Profit taking remains highly recommended. Small and Mid-cap stocks, Energy, Materials, and Industrials outperformed the index as well. The problem, as stated above, is that a stronger dollar and higher interest rates will likely hamper this optimism sooner rather than later. This is particularly the case with Small and Mid-Cap companies that are the most susceptible to monetary tightening.
(Note: I have changed the sector and major market analysis charts to a 50/200 DMA crossover signal and embedded an overbought/sold indicator.)
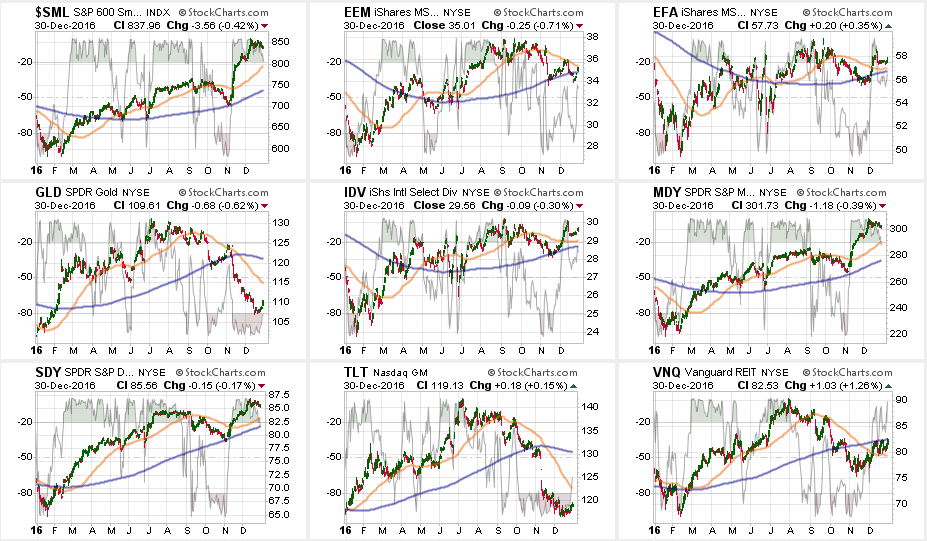
The table below shows thoughts on specific actions related to the current market environment. (These are not recommendations, just ideas related to market extremes and contrarian positioning within portfolios. Use at your own risk and peril.)
Over the last couple of weeks, as suggested, we have continued to hedge our long-equity positions with deeply out-of-favor sectors of the market (Bonds, REIT’s, Staples, Utilities) which paid off well during the volatility last week.
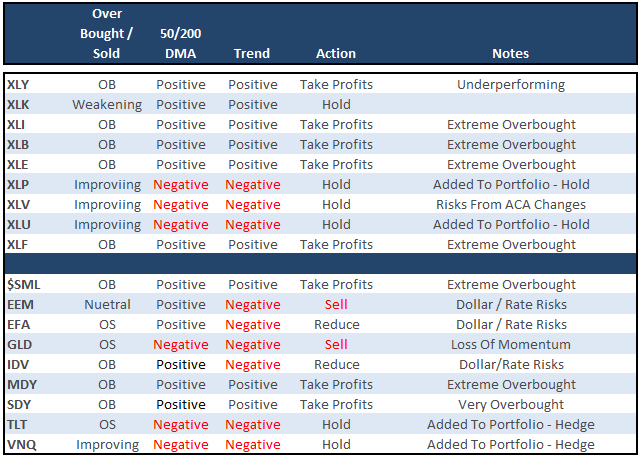
As I have been warning over the last couple of months, the stronger dollar and the rise in rates should not be dismissed.
Everything is currently pointing to this being a very late stage advance, so profit taking, hedging, and rebalancing is strongly advised.
THE REAL 401k PLAN MANAGER
The Real 401k Plan Manager – A Conservative Strategy For Long-Term Investors
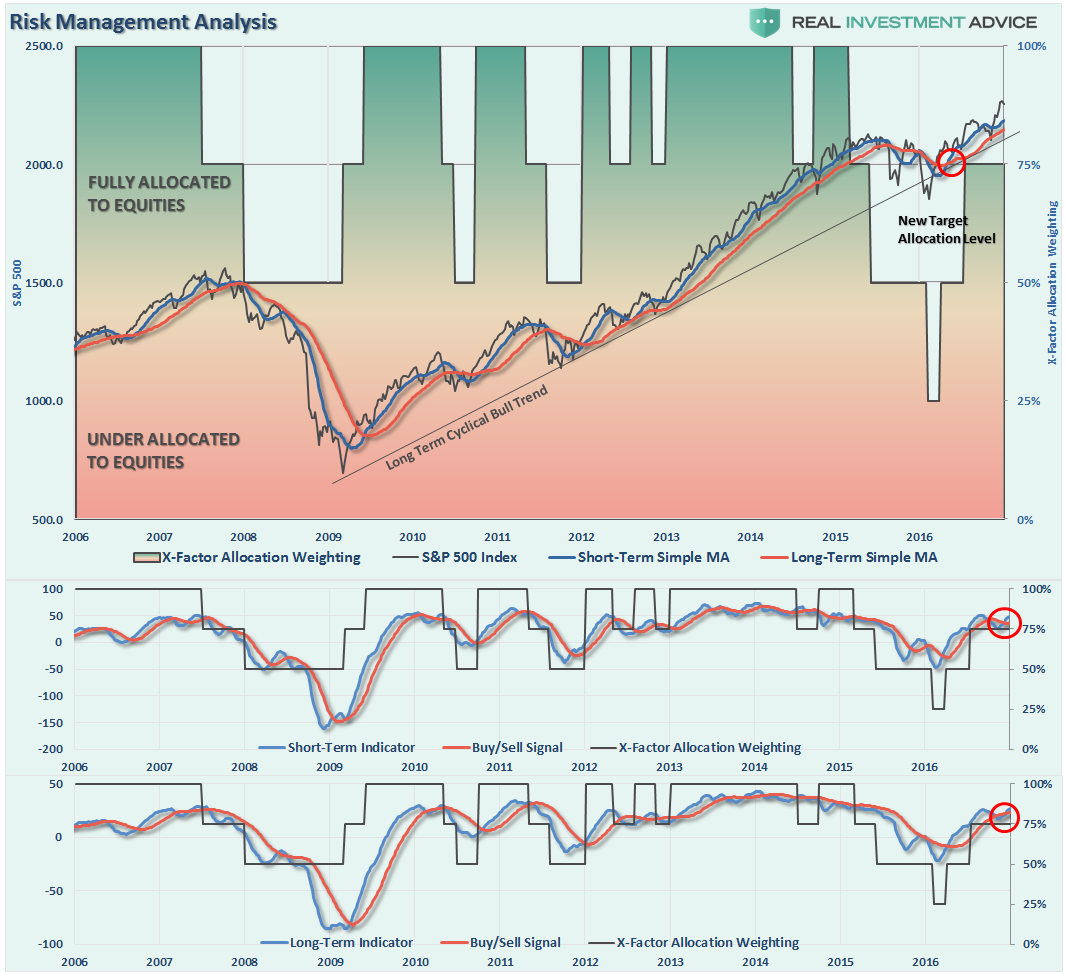
There are 4-steps to allocation changes based on 25% reduction increments. As noted in the chart above a 100% allocation level is equal to 60% stocks. I never advocate being 100% out of the market as it is far too difficult to reverse course when the market changes from a negative to a positive trend. Emotions keep us from taking the correct action.

Happy New Year
With the last holiday-shortened trading week ahead for a while, look for some selling to continue into the New Year as positions are rebalanced. (Managers can take in gains and not pay taxes until 2018)
The last three years have seen some pretty decent corrective actions in January. However, when you have three years in a row of anything, the odds rise this year could be different.
With buy signals on all three indicators registered currently, any corrections are likely to be somewhat limited back to the rising short to intermediate-term moving average. This would suggest a correction back to 2200 would likely be a “buyable” trading level.
However, it should not be forgotten that we are long into a cyclical bull market. Therefore, “tradeable” rallies should be treated as short-term opportunities as long as extreme overbought, overbullish and overvalued conditions exist as they do now.
I continue to suggest using current levels to clean up portfolios as detailed in previously.
Step 1) Clean Up Your Portfolio
Step 2) Compare Your Portfolio Allocation To The Model Allocation.
(Note: the primary rule of investing that should NEVER be broken is: “Never invest money without knowing where you are going to sell if you are wrong, and if you are right.”)
Step 3) Have positions ready to execute accordingly given the proper market set up. In this case, we are looking for a correction to reduce the overbought condition of the market to allow for a better opportunity to rebalance equity risk.
The big risk remains when the markets eventually come to grips with the rise in rates, simultaneously with a stronger dollar, which will quickly erode earnings in an already over-valued market. Pay attention.
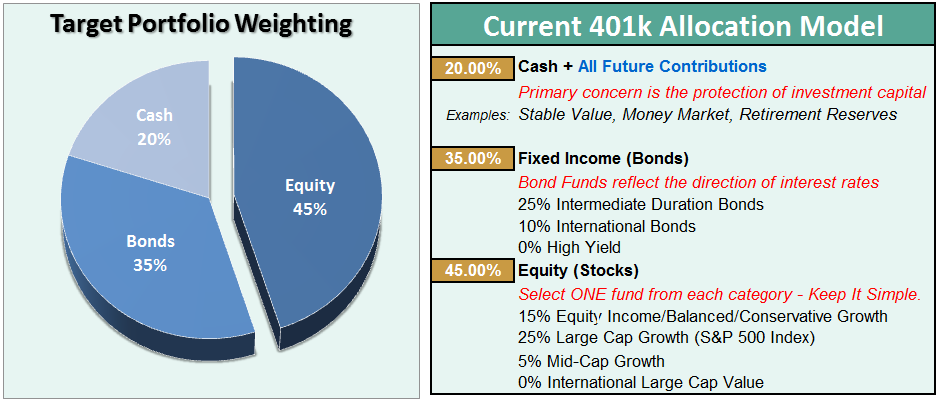
Current 401-k Allocation Model
The 401k plan allocation plan below follows the K.I.S.S. principal. By keeping the allocation extremely simplified it allows for better control of the allocation and a closer tracking to the benchmark objective over time. (If you want to make it more complicated you can, however, statistics show that simply adding more funds does not increase performance to any great degree.)
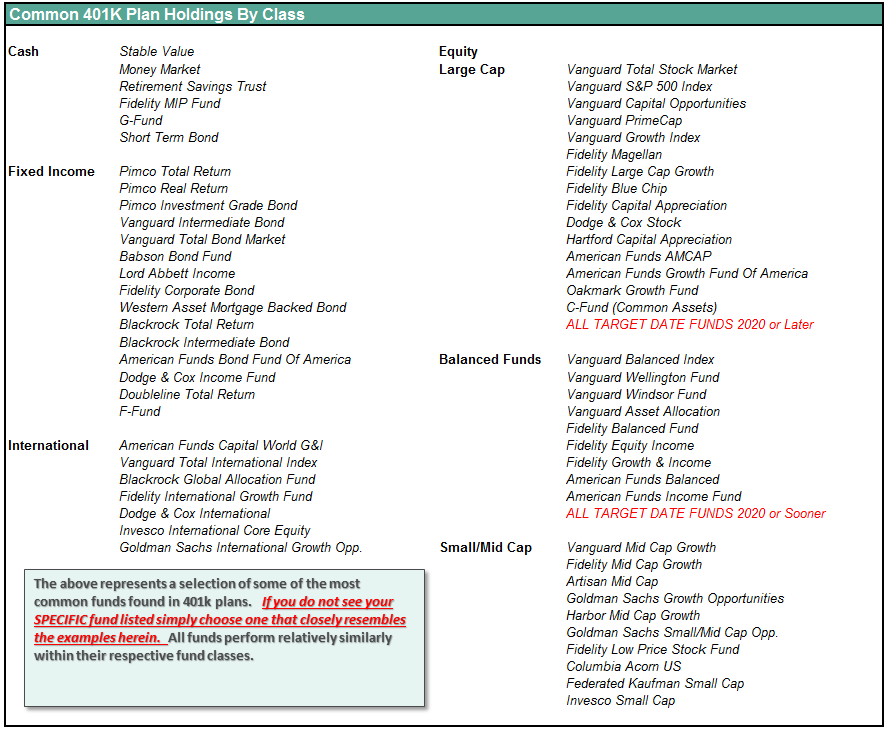
401k Choice Matching List
The list below shows sample 401k plan funds for each major category. In reality, the majority of funds all track their indices fairly closely. Therefore, if you don’t see your exact fund listed, look for a fund that is similar in nature.
