NVDA Q3 Earnings Alert: Why our AI stock picker is still holding Nvidia stockRead More

New Sell Signal Triggered On Weekly SPX:VIX Ratio

Published 10/26/2017, 06:20 AM
Updated 07/09/2023, 06:31 AM
US500
-
VIX
-

I last wrote about the SPX:VIX ratio in my post of mid-October. At the time, volatility was creeping higher, as the SPX was making new highs.

As of 2:00 PM on Wednesday, volatility continued to rise, as the ratio dropped to just above the critical 200 "New Bull Market" level, as shown on the following SPX:VIX monthly ratio chart.
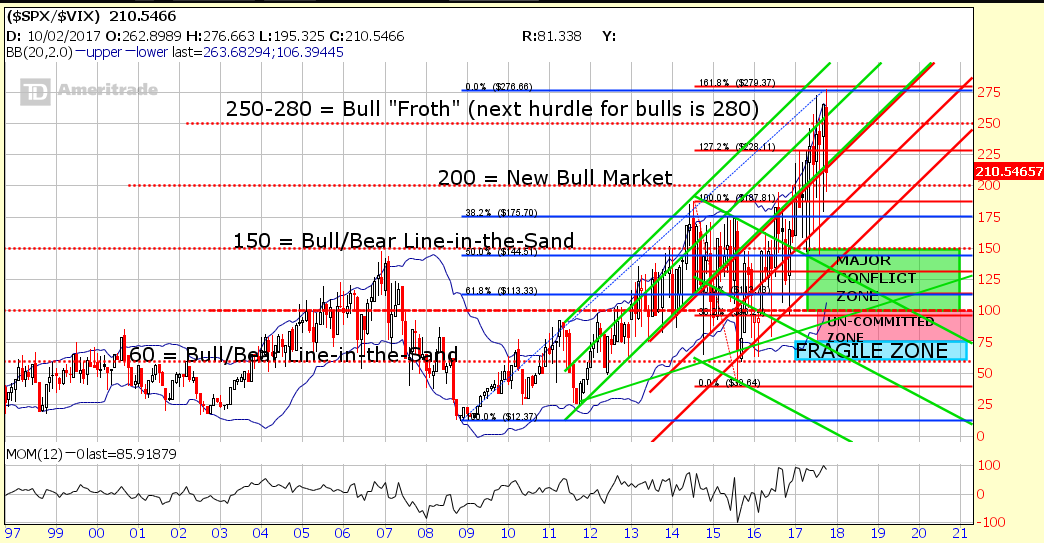
SPX-VIX Chart

The following 60-day, 60-minute ratio chart shows that, although one gap up has been filled, there are two unfilled gaps remaining, dating back to September 11.
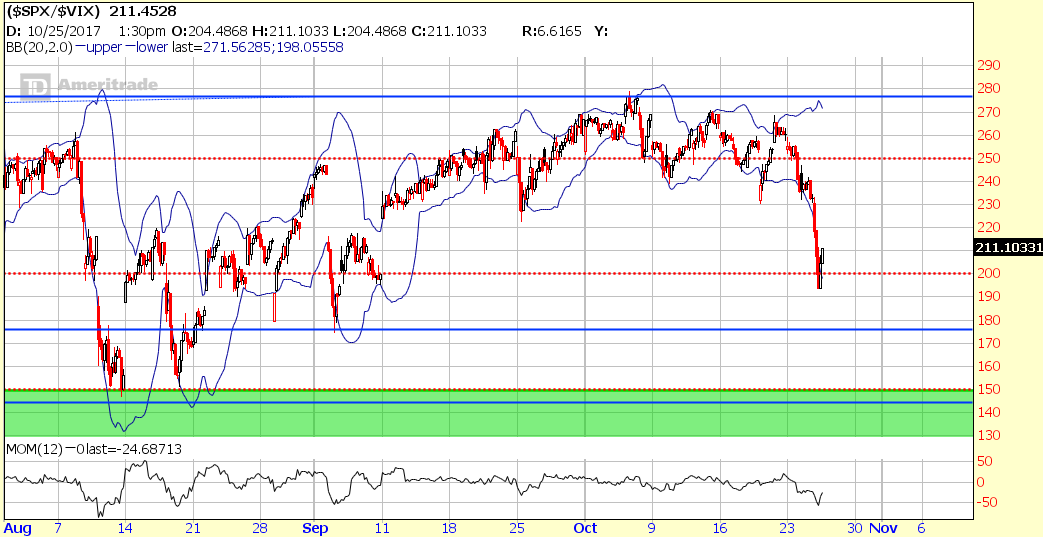
SPX-VIX 60-Day, 60-Minute Chart

A new "SELL" signal has just triggered on the weekly ratio, as shown below.
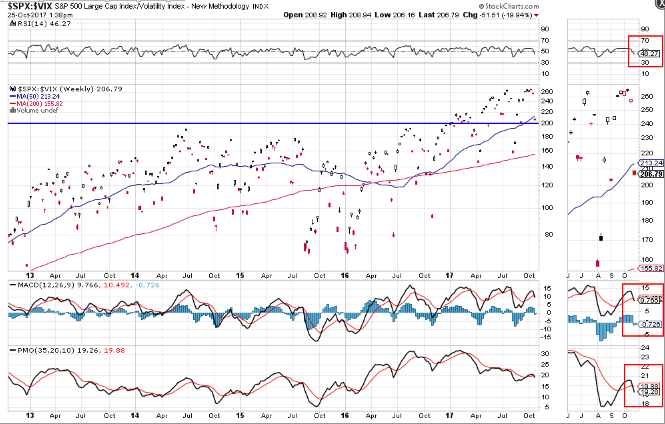
SPX-VIX Weekly Chart


The SPX nearly reached a potential target of 2600 on Monday, as shown on the following daily chart, where it will encounter major resistance in the form of a +2 deviation level of a very long-term regression channel, as I outlined in my above-mentioned post.
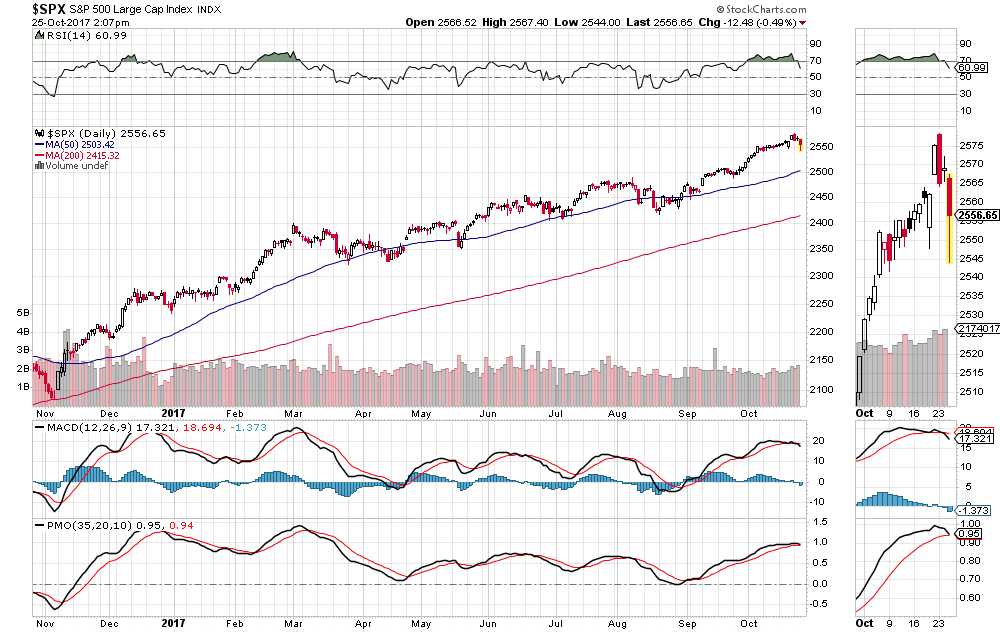
SPX Daily Chart

Keep an eye on these charts, especially the 60-day, 60-minute, to see if the prior gaps are filled, and whether the ratio drops and holds below 200. If so, expect volatility to increase as weakness sets in on the SPX. If not, the SPX may try, again to reach 2600 before such a scenario may develop.

In any event, the SPX may whipsaw until after the next {{frl||Fed meeting}} concludes on November 1, before it either continues to advance to new highs, or we see a pullback, and gap fills on the intraday ratio.

Latest comments

Loading next article…
Risk Disclosure: Trading in financial instruments and/or cryptocurrencies involves high risks including the risk of losing some, or all, of your investment amount, and may not be suitable for all investors. Prices of cryptocurrencies are extremely volatile and may be affected by external factors such as financial, regulatory or political events. Trading on margin increases the financial risks.
Before deciding to trade in financial instrument or cryptocurrencies you should be fully informed of the risks and costs associated with trading the financial markets, carefully consider your investment objectives, level of experience, and risk appetite, and seek professional advice where needed.
Fusion Media would like to remind you that the data contained in this website is not necessarily real-time nor accurate. The data and prices on the website are not necessarily provided by any market or exchange, but may be provided by market makers, and so prices may not be accurate and may differ from the actual price at any given market, meaning prices are indicative and not appropriate for trading purposes. Fusion Media and any provider of the data contained in this website will not accept liability for any loss or damage as a result of your trading, or your reliance on the information contained within this website.
It is prohibited to use, store, reproduce, display, modify, transmit or distribute the data contained in this website without the explicit prior written permission of Fusion Media and/or the data provider. All intellectual property rights are reserved by the providers and/or the exchange providing the data contained in this website.
Fusion Media may be compensated by the advertisers that appear on the website, based on your interaction with the advertisements or advertisers.
© 2007-2024 - Fusion Media Limited. All Rights Reserved.