Gold has been on the cusp of a major breakout but someone forgot to tell the gold stocks. Gold is right back at resistance levels yet the various gold stock indices are off their September 2017 highs by 11% to 16%. The relative weakness in the gold stocks (and Silver) is a signal that Gold is unlikely to break out now. In fact, if Gold were to correct here the gold stocks could threaten support and perhaps make new lows. While that sounds quite bearish, history shows that a break to new lows in gold stocks would be a massive buy signal.
The history we refer to is the path of recovery for a market following a mega-bear, which we define as nearly 3 years and at least an 80% decline. There are three strong historical examples. Those are the S&P 500 during the Great Depression, Thailand after its bust in the mid to late 90s and the housing stocks after 2005 to the March 2009 low. The recovery in each (following the mega-bear) followed three distinct phases. There is a sharp initial rebound which is followed by a correction and lengthy consolidation which lasts at least 18 months. Eventually, the long consolidation ends and the market surges higher in an impulsive fashion.
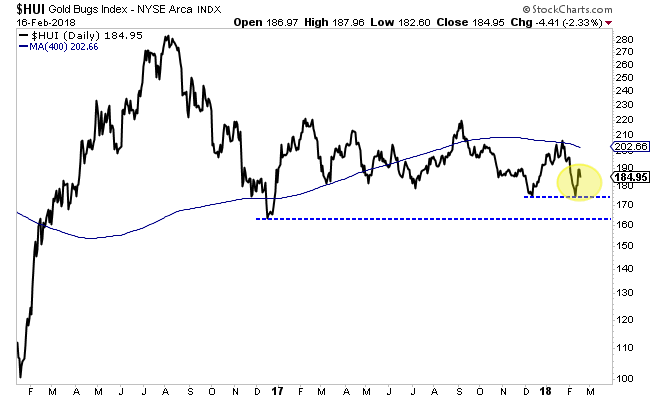
The gold stocks are currently in the 19th month of their correction and consolidation. They bounced from support in December but retraced that entire bounce. After a second rebound from support, they could threaten a break of that support. Below we show the HUI Gold Bugs Index which does not include the royalty companies as VanEck Vectors Gold Miners (NYSE:GDX) does. The HUI is not too far from its December 2016 low and could even break it if Gold were to correct.

Conventional technical analysis would imply that is a sell signal for the gold stocks. But history argues the complete opposite.
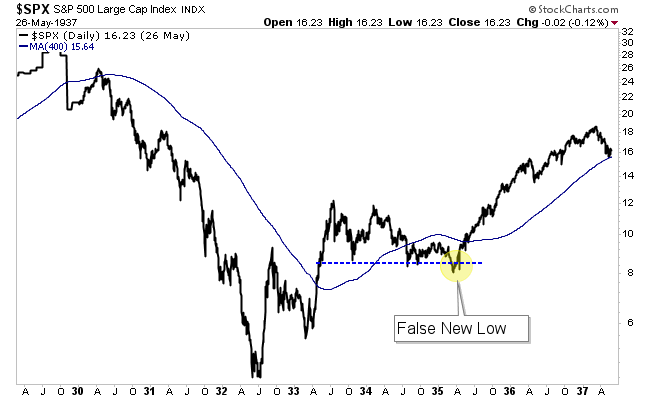
In the 21st month of its correction and consolidation in 1935, the S&P 500 had broken down to a 2-year low. Was the market headed for a retest of the Great Depression low?

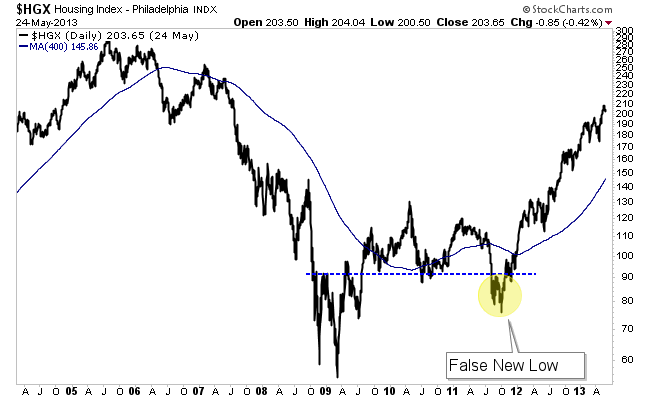
In the 19th month of its consolidation in the fall of 2011, housing stocks had broken to a 2-year low. Was the sector headed for a retest of the Global Financial Crisis low?

Thailand’s correction and consolidation phase was different than the others as it made its low only 15 months in, but then consolidated and ground slightly higher for the next 13 months before exploding to the upside. At its corrective price low 15 months in, the index was at a 2-year low.
The HUI closed Friday just below 185. Its December 2016 low is 163.49. A 12% decline would put it below its December 2016 low and at a 2-year low.
The three historical examples all made 2-year lows before their correction and consolidation phase ended.
A potential failed breakout or correction in Gold could leave gold stocks vulnerable to a decline to new lows. While that sounds bearish, the historical context argues otherwise. Two of the three historical examples that show similarities to the gold stocks broke to new lows. Yet that break proved to be the best buying opportunity since the bear market low.
All three of the historical examples made 2-year lows before exploding higher. History shows that if the HUI Gold Bugs Index were to break to new lows it could be a false break and a massive buy signal. Quality juniors that are bought on forthcoming weakness (if Gold corrects) should deliver fantastic returns over the ensuing 12 to 18 months.
