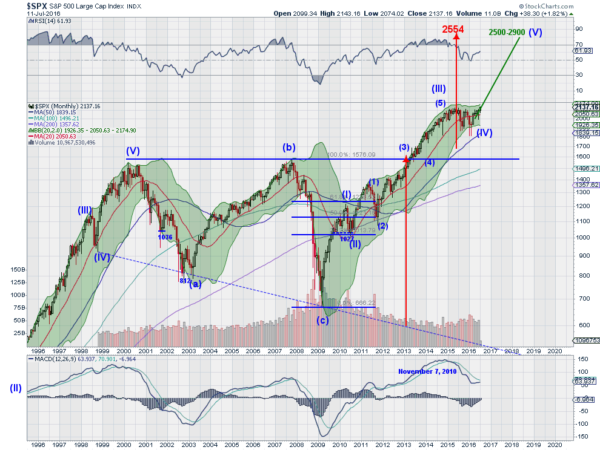
After a multi-year run higher the S&P 500 made a new all-time high Monday. 16 months ago this was happening at least 15 times per month. But this all-time high was the first since May 20, 2015, over 13 months ago. It comes after a 12% and a 15% pullback. Will it hold up? Only time will tell. There are many indications though that it will.
The first is how the Index dealt with the 200 day SMA on its last touch. a one day plunge below and then near instant recovery. The 200 day SMA is the most basic of technical analysis indicators. Above it is bullish and below it bearish. To pullback to the 200 day SMA and then rebound higher is a bullish scenario. The Index has been over its 200 day SMA for nearly 4 months now, except for that one day.

The momentum indicators also support continued movement higher. The RSI is in the bullish zone and rising, while the MACD is crossed up and rising. The Bollinger Bands® are also opening higher as the Index rises. So the price action, 200 day SMA, RSI, MACD and Bollinger Bands all support more upward price action. How far will it go?
There is no resistance above as the Index has never been higher. Longer term chart projections look for a move to 2500 or higher using technical patterns and Elliott Wave techniques. It will certainly not be a straight line there though. Add to those the chart above. It suggests a target of 2460 on a break of this expanding wedge to the upside.
Add in as well the Point and Figure chart using the Average True Range as a box size now sees a bullish price objective of 2363. Three targets from 3 separate forms of technical analysis suggesting moves over 2450 and a fourth over 2350. That could have the making for a great 2nd half of 2016.
The information in this blog post represents my own opinions and does not contain a recommendation for any particular security or investment. I or my affiliates may hold positions or other interests in securities mentioned in the Blog, please see my Disclaimer page for my full disclaimer.
