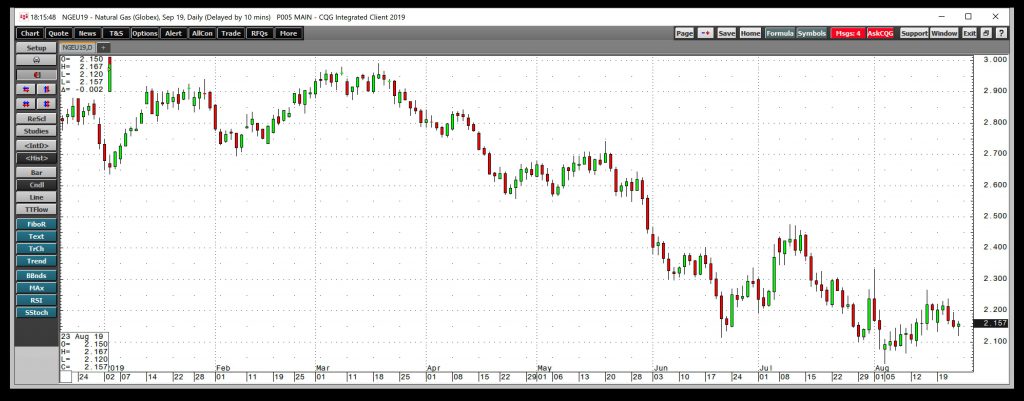
After reaching a low at $2.029 per MMBtu on the September futures contract on August 5, the natural gas futures market attempted to recover. The first target on the upside was the August 1 peak at $2.333 per MMBtu. However, after reaching a lower high at $2.267 on August 15, the price failed once again and ended last week at below the $2.20 level.
The latest price failure in the natural gas market was another in a long series that began last November when the price reached the highest level since 2014 at $4.929. The summer is coming to a close, and the market will start to focus on the peak season of demand that begins in mid-November. There are approximately 12 weeks left in the injection season, and the change in seasons could shift the sentiment in natural gas sooner rather than later.
The United States Natural Gas (NYSE:UNG) is the most liquid non-leveraged ETF product in the natural gas arena. However, the triple-leveraged UGAZ and DGAZ bullish and bearish ETN products could attract lots of interest over the coming weeks. Traders will begin to focus on the time of the year, where volatility and the price of the energy commodity typically rises.
A bearish summer pushes the price to the lowest level since 2016

On August 5, the price of nearby NYMEX natural gas futures fell to the lowest price since 2016 at $2.029 per MMBtu.
The daily chart of the soon to expire September futures contract shows that natural gas has been in a bearish trend throughout 2019. The price continues to make lower highs and lower lows. The last attempt to rise above a previous high came this month when the price bounced from $2.029. However, the September futures failed to reach the first level of technical resistance. Last Friday, the price settled at $2.1520 per MMBtu.
September futures roll to October

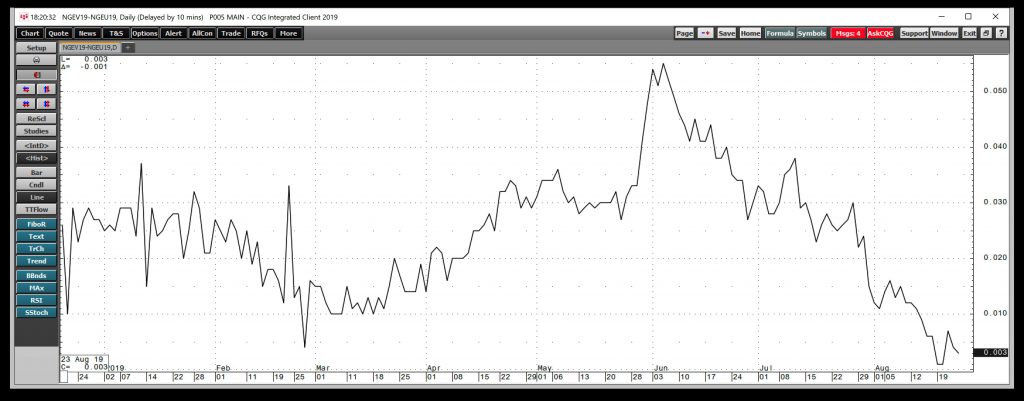
September futures were rolling to October last week, and the spread between the two contracts collapsed to virtually unchanged.
The chart of the price of October minus September NYMEX natural gas futures shows that the spread moved to a level where the two contracts were at almost the same price at the end of last week. The steady decline in the differential could be a sign that more market participants with short positions are rolling their risk compared to those with long positions. When a short extends the position to the next active contract month, they must repurchase the nearby and sell the next month, putting downside pressure on the spread. The extension of positions could mean that aggressive shorts will attempt to push then price lower, and perhaps below the $2 per MMBtu level over the coming days and weeks.
November is the start of the peak season for demand
Meanwhile, the shorts could be running out of time when it comes to pushing natural gas prices lower. The peak season for demand will be only eleven weeks away after the next EIA inventory report. The injection season where inventories grow will shift to the withdrawal season when they decline starting in mid-November.
Each year, the uncertainty of the winter season tends to cause at least one significant rally in the natural gas futures market. Last year, nearby prices rose to $4.929 per MMBtu. With January futures settling at $2.508 per MMBtu at the end of last week, the risk-reward profile of the natural gas market is attractive at its current price level. However, the prospects will improve dramatically if the shorts are successful and push the price to $2 per MMBtu or lower in the coming days and weeks. We could be on the verge of a bargain in the natural gas market as the summer ends. The fall season means we are one step closer to the time of the year where heating demand across the US peaks.
The United States Natural Gas Fund L.P. (UNG) was trading at $19.00 per share on Tuesday afternoon, down $0.31 (-1.61%). Year-to-date, UNG has declined -18.52%, versus a 8.01% rise in the benchmark S&P 500 index during the same period.
UNG currently has an ETF Daily News SMART Grade of C (Neutral), and is ranked #51 of 109 ETFs in the Commodity ETFs category.
