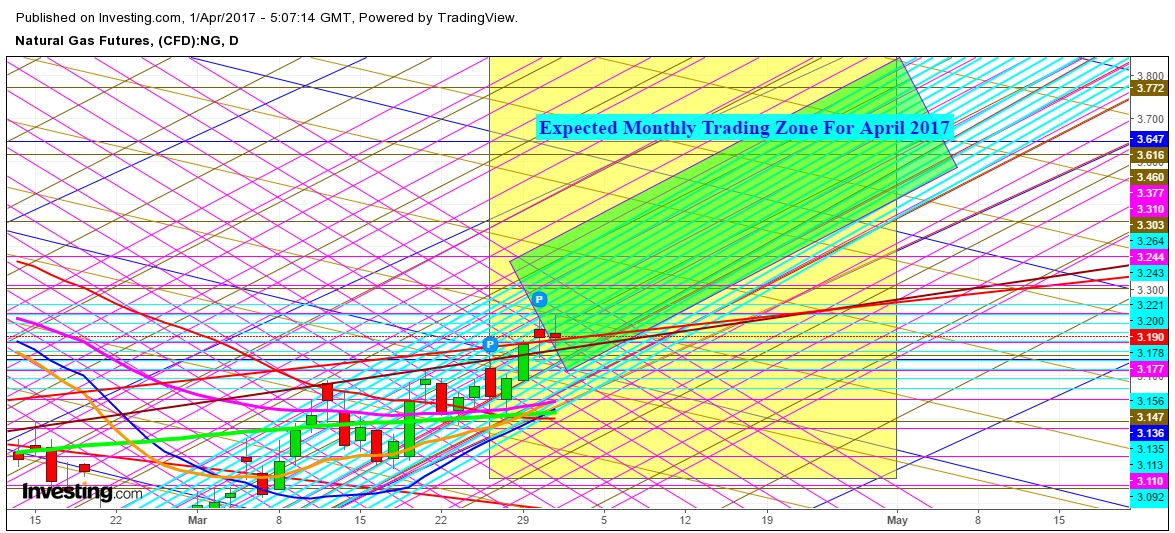
Natural Gas futures price moved during the month of March,2017 well inside the Expected Monthly Trading Zone as I predicted in my analysis. I predicted this trading zone for the March, 2017 in two different charts, perhaps has been vanished from the memory of my valuable readers. Current movement position of the natural gas futures price may be seen at the end of the month of March, 2017 projected in both charts in the attached PDF file. If we compare the current position of natural gas futures price with its position on March 6th, 2017 when it was at $2.823; when I submitted the above mentioned analysis, we find that the movement is well as was predicted during the month of March, 2017.
Secondly, if we see the movement of natural gas futures price, during the week of March 26th, 2017, what I predicted in my analysis. If we compare the current position of natural gas futures price with its position on March 25th, 2017 when it was trading at $3.083; when I submitted the above mentioned analysis, we find that the movement is well as was predicted during the week of March 26th, 2017.
While discussing all these recent past moves, my aim is not to prove the accuracy of my all past analyses, I just want to go too deep to dig out a more reliable prediction of the future directional moves of natural gas futures price. Though, most of my analysis, especially which I have just mentioned above, received more criticism at the time when I submitted them but latter on most of my real evaluating readers did not hesitate to come forward and realized.
On analysis of the movement of natural gas futures price in different time zones, I have prepared an Expected Trading Zone for the Month of April, 2017 in daily chart zone. I find that the strength of reversal move in natural gas futures price, seen on March 31st, 2017 looks more prudent for a gap up opening on the first trading session of the week of April 2nd, 2017 and strength of the further moves will be too strong to move natural gas well according to expected weekly trading zone.
Natural Gas Daily Chart – Expected Trading Zone for the month of April, 2017*
Have A Nice Trading Time
* All the above mentioned charts may be seen in the attached PDF
Disclaimer: This analysis is purely based on the technical observations. I do not have any position in natural gas. One can create position in natural gas at his/her own risk.

