National Retail Properties (NYSE:NNN) is a retail REIT with a market cap of $5 billion.
The company has delivered investors compound total returns of 15.9% a year over the last 25 years. For comparison, the S&P 500 delivered total returns of 9.6% a year over the same period.
The last 25 years have been excellent for National Retail Properties shareholders. The company has also paid increasing dividends for the last 25 years – a claim very few other businesses can match.
National Retail Properties management is excellent. I strongly recommend reading the company’s most recent annual report. CEO Craig Macnab outlined the company’s strategy for rewarding shareholders in the company’s most recent annual report:
“Our management team is convinced that we will continue to build value over the medium to long-term for our shareholders by:
– Carefully allocating capital into well-underwritten retail properties;
– Focusing our energy on increasing per share value as opposed to simply growing our asset base;
– Evaluating all corporate or large portfolio acquisition opportunities, but only pursuing those which are consistent with our goal of building long-term shareholder value;
– Maintaining a conservative and flexible balance sheet which allows for future growth.”
Notice how he says management is “focusing our energy on increasing per share value as opposed to simply growth our asset base”. That is exactly what every publicly traded company should be doing – but very few actually do it.
Based on National Retail Properties’ excellent 25 year track record, management not only talks-the-talk, they also walk-the-walk.
10 Year Analysis
National Retail Properties has compounded funds-from-operations-per-share (Called FFO-per-share hereafter) at just 3.8% a year over the last decade. Dividends have grown even slower at 2.7% a year over the last decade.
The reason for the sluggish growth is the Great Recession. National Retail Properties’ FFO-per-share fell from $1.91 in 2008 to $1.13 in 2009. FFO-per-share did not match 2008 levels again until 2013. The company’s slow growth is a result of weakness during the Great Recession – and especially in 2009.
What has grown quickly over the last decade for National Retail Properties is its share count. Diluted shares outstanding have grown at 9.7% a year. For comparison, the company has seen its debt grow at 8.5% a year over the same time period.
There is nothing intrinsically wrong with share issuances.When share issuances are done while a company is trading above intrinsic value, they can be beneficial to shareholders because the company is selling shares worth (as an example) $1.00 for $1.20, the company can reinvest the proceeds in fairly valued or undervalued opportunities, thereby increasing shareholder wealth despite share count dilution.
The table below shows the % increase in share count each year, and National Retail Properties’ dividend yield for each year starting in 2006:
| Year | 2006 | 2007 | 2008 | 2009 | 2010 | 2011 | 2012 | 2013 | 2014 |
| % Increase | 6.5% | 14.3% | 12.2% | 7.5% | 3.6% | 7.2% | 22.8% | 9.8% | 4.0% |
| Div. Yield | 5.9% | 5.7% | 7.0% | 8.2% | 6.4% | 5.8% | 5.3% | 4.7% | 4.5% |
The lower the dividend yield, the better share issuances are. The higher the dividend yield, the more you’d like to see share repurchases instead.
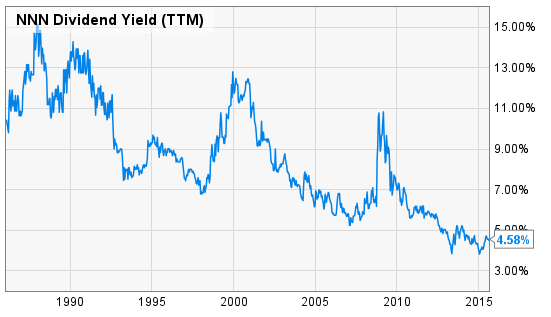
Over the last 30 years or so, National Retail Properties has had an average dividend yield of around 7%. To National Retail Properties’ management’s credit, the company has issued more shares when the company was overvalued (when yields were low) than when the company was undervalued (when yields were high. Management appears to have reduced share issuance activity in 2009 and 2010 while yields were higher, and issued more shares when yields were lower (like 2012, as an example).
I would have liked to see National Retail Properties issue more shares in 2014 when yields were near all time lows. Still, the company has done a fairly good job of timing share issuances over the last decade.
Recent Results & Total Returns
National Retail Properties posted excellent results in its most recent quarter. The company saw FFO per share grow 10% versus the same quarter a year ago.
Solid FFO growth shows that National Retail Properties’ growth pan of working primarily with non-publicly traded retailers that offer rental rate increases continues to work well.
Recent growth is far above the company’s historical average. National Retail Properties is currently benefiting from an overabundance of cheap capital – both debt and equity. The company’s shares are likely overvalued, so it can easily tap equity markets for new investments. Additionally, issuing debt is very attractive right now as well due to extremely low interest rates.
If the United States economy enters into another recession, National Retail Properties’ growth will slow, or even turn negative as it did during the Great Recession.
Valuation – When To Buy
If it’s not apparent yet, I am extremely bullish on National Retail Properties’ long-term growth prospects and management.
Unfortunately, so are a lot of other investors. The image below shows the company’s dividend yield since the 1980’s:

As you can see, now is historically one of the worst times in the last 30 years to purchase National Retail Properties. A better time to purchase would be any time the stock’s yield jumps above 7%.
The best times to buy National Retail Properties have been during large recessions. There have been opportunities to purchase this stock when it was yielding 10% or more in the last decade.
Now is simply not the right time to purchase National Retail Properties – though I certainly wouldn’t sell such a high quality business with a long growth runway either.
