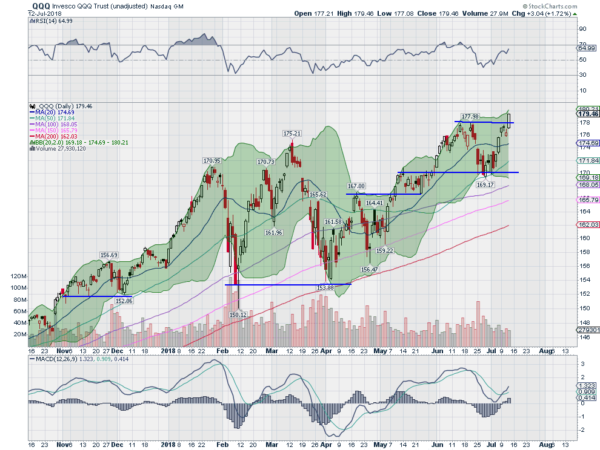
The NASDAQ 100 closed at a new all-time high level on Thursday. They way it did it bodes well for a lot more upside in the Index. The chart below of the NASDAQ 100 ETF ($QQQ) shows the story. A bounce off of the lower Bollinger Bands® and a retest if the May break out ran higher into July. A digestive pause earlier this week was then followed by a strong move higher Thursday. It printed a bullish Marubozu candle on the day, opening at the low and driving higher all day to close at the high.
The Measured Move places a target of 189 on this push higher. And that is not unrealistic looking at the indicators. The RSI and MACD, momentum indicators are solidly bullish. The RSI is rising in the bullish zone and has room before becoming overbought. The MACD just crossed up and is far from extreme values where the price has reversed. The Bollinger Bands are also opening up as the price touches the upside. This allows for a continued Move higher as well.

Despite the strong run, sentiment is not running hot. One measure, the CNN Fear and Greed gauge is just at 49, a neutral reading. Pundits will point out that not every market is at the high. A fair point, but all are within a few percentage points of their all-time high. You will also hear about solar eclipse happening today and how that is a turning point. Or about how Friday the 13th can reek havoc on markets. The contra-opinion will always be there. It sells ads. But for now know that all-time highs beget more all-time highs and enjoy the ride higher.
The information in this blog post represents my own opinions and does not contain a recommendation for any particular security or investment. I or my affiliates may hold positions or other interests in securities mentioned in the Blog, please see my Disclaimer page for my full disclaimer.
