Nasdaq To Extend Its Bounce?

Published 11/27/2018, 04:19 AM
NDX
-

Among the large US indices, the Nasdaq 100 has fallen the furthest from its highs. However, we’re starting to see signs that the tech benchmark could be oversold.

We can see on the weekly chart that, having fallen over 15% from its highs, the Nasdaq is now within its second worst drawdown since the Nasdaq bubble burst. Interestingly, the prior two times it has fallen 15% or more post-bubble, the index has posted a solid recovery. Whilst this may not provide a solid buy signal within its own right, it does provide food for thought and send a warning to bears, especially given the clues on the daily chart.
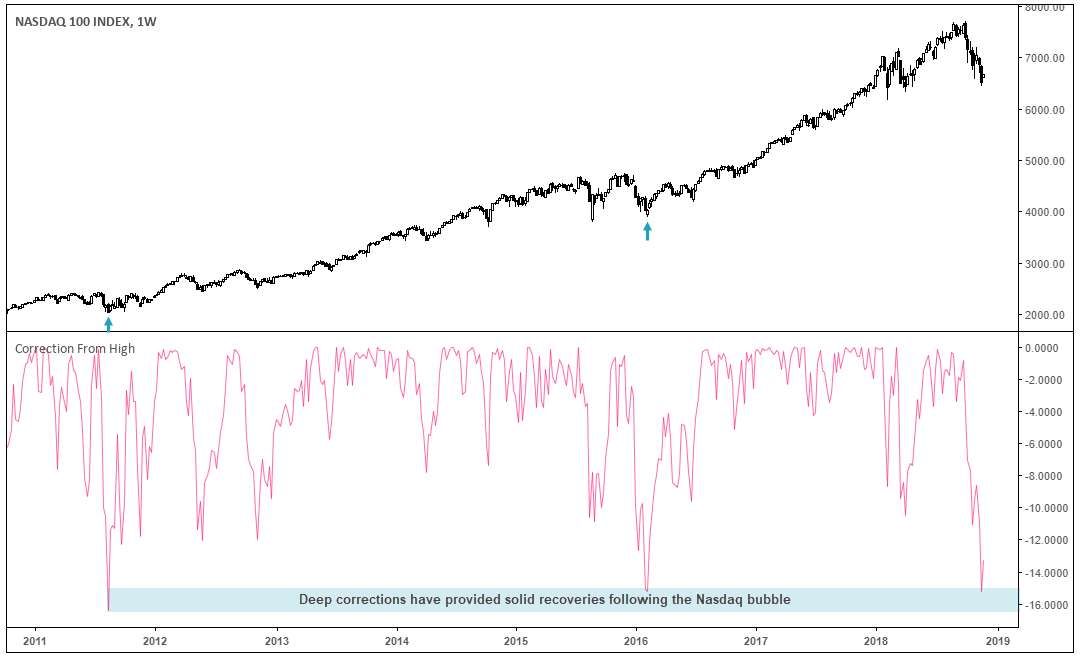
Nasdaq 100 Index 1 Week Chart

Switching to the daily chart shows the index remains within a downtrend with its series of lower highs and lows. However, a bullish divergence with RSI warns that downside momentum is waning, and prices have since returned above the lower Keltner band to show mean reversion is now underway.
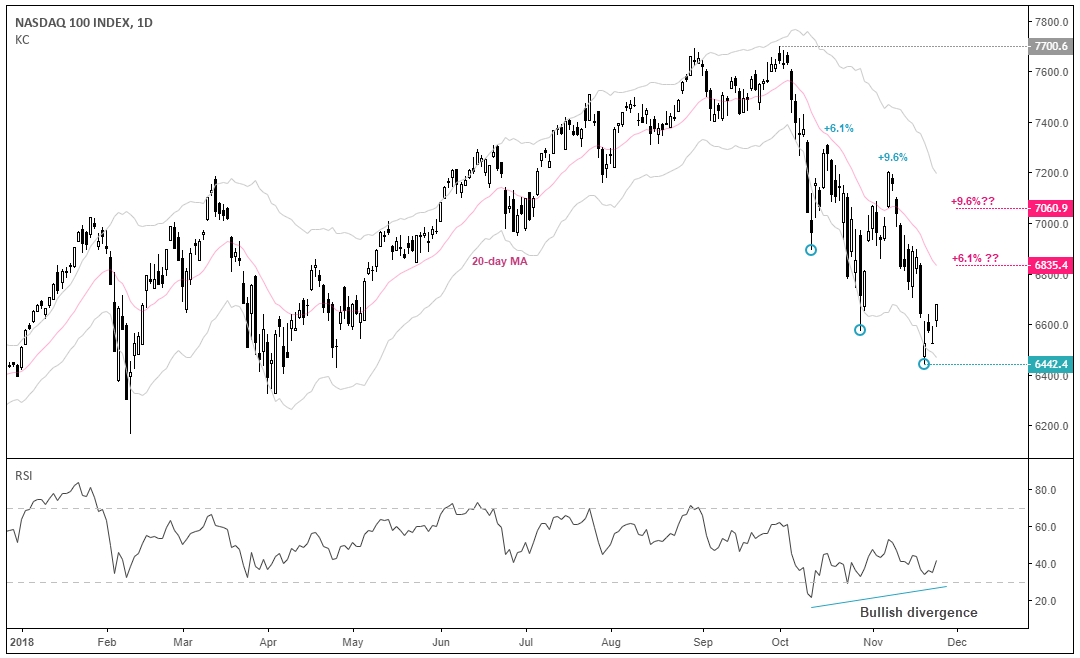
Nasdaq 100 Index 1 Day

Since falling from the 7700.6 high there have been three occasions where it has bounced back above its lower Keltner. And whilst the current move from 6442.4 has recovered by 3.8% already, it’s worth noting that the prior two rebounds above the lower Keltner retraced around 6.1% and 9.6% from their lows. Considering the choppy nature of the bearish trend structure, a rebound of similar magnitude is not impossible. Using the 6.1% and 9.8% retracements as a hypothetical guide we could see the Nasdaq rebound towards 6835.4 (near the 20-day average) or 7060.9.

This could provide bullish opportunities for counter-trend traders or serve as levels to seek signs of price exhaustion with a view to short the index later, in line with dominant momentum.

Original post

Latest comments

Loading next article…
Risk Disclosure: Trading in financial instruments and/or cryptocurrencies involves high risks including the risk of losing some, or all, of your investment amount, and may not be suitable for all investors. Prices of cryptocurrencies are extremely volatile and may be affected by external factors such as financial, regulatory or political events. Trading on margin increases the financial risks.
Before deciding to trade in financial instrument or cryptocurrencies you should be fully informed of the risks and costs associated with trading the financial markets, carefully consider your investment objectives, level of experience, and risk appetite, and seek professional advice where needed.
Fusion Media would like to remind you that the data contained in this website is not necessarily real-time nor accurate. The data and prices on the website are not necessarily provided by any market or exchange, but may be provided by market makers, and so prices may not be accurate and may differ from the actual price at any given market, meaning prices are indicative and not appropriate for trading purposes. Fusion Media and any provider of the data contained in this website will not accept liability for any loss or damage as a result of your trading, or your reliance on the information contained within this website.
It is prohibited to use, store, reproduce, display, modify, transmit or distribute the data contained in this website without the explicit prior written permission of Fusion Media and/or the data provider. All intellectual property rights are reserved by the providers and/or the exchange providing the data contained in this website.
Fusion Media may be compensated by the advertisers that appear on the website, based on your interaction with the advertisements or advertisers.
© 2007-2025 - Fusion Media Limited. All Rights Reserved.