Over the past two weeks, I have kept you abreast of the Nasdaq 100’s most likely path forward (see my articles here, and here).
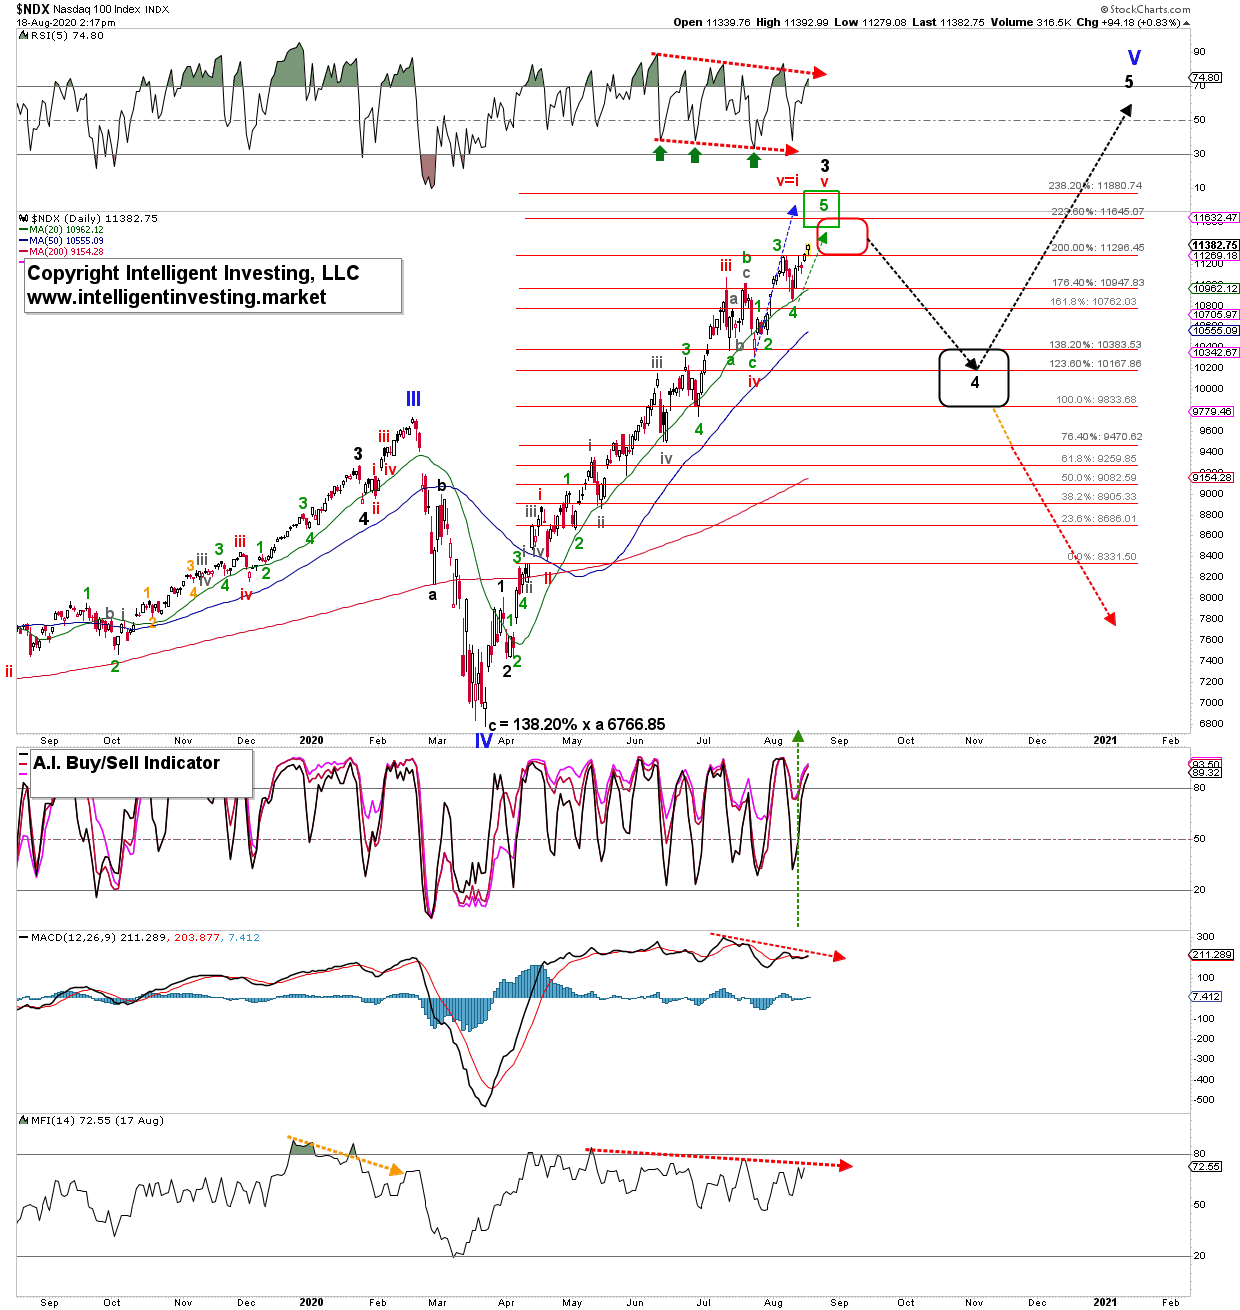
Last week, I showed I was looking for ideally $11,600-11,700 (dotted green and blue arrows), and now, one week later, the index is starting to get there as it is currently trading at $11,380+. The index could even move as high as $11,880, but for now, I find that less likely.
Figure 1. NDX100 Daily Candlestick Chart With EWP Count

With the price action over the last weeks moving along as anticipated, I still see no reason to change my overall point of view unless the Nasdaq now closes below last Friday’s low of $11,107. Thus, as I wrote two weeks ago, with a few very minor tweaks:
“… once this (green) 5th wave completes, it completes a larger five-waves up (red i, ii, iii, iv, and v). This pattern would fit well with the more and more negatively diverging technical indicators (red dotted arrows). The index is moving higher on less momentum, and eventually, the index will catch up with this divergence and start a more significant correction: black wave-4. Once the index reaches the red [to green] target zone, I expect it to complete black wave-3. Then, as said, a more significant correction should unfold, ideally back to $10,385-9,825 with the upper end preferred because, in bull markets, the upside surprises and the downside disappoints. From that ideal [larger degree] wave-4 target zone, I anticipate the last black wave-5 up to new ATHs. [This wave-5] will, in turn, complete the impulse up off the March 23 low as well as the entire bull since 2009, possibly since 2002.”
Thus upside reward is, in my humble opinion, at this stage, 1.9 to 4.4%, and downside risk 8.8 to 13.6%. As usual, know your time frame, trading/investing style and always act accordingly.
