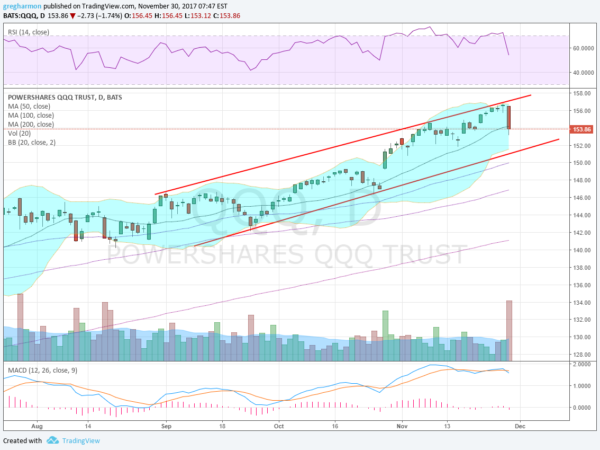
Wednesday the Nasdaq 100 had an epic melt down. Losing over 140 points at the low it managed to recover a little and close down only 111 points. A massive change of direction. With heavy volume this could be the turning point that every pundit has been warning us about for the past 8 years. Or it could just be normal rotation out of tech stocks that have run up a lot in 2017 and into other sectors like financials. So how do you know?
The short answer is that you never know until long after the fact. But you can look at the price action to plan for whichever it is. The chart of the PowerShares QQQ Trust Series 1 (NASDAQ:QQQ) ETF below can help create a road map and navigate the journey. It shows the Nasdaq rising in a channel since the beginning of September. In this view the price touched the top of the channel Tuesday before the pullback Wednesday. It also shows the pullback finding some support at the 20 day SMA.

It was a bloody day, no question. But a reversal at the 20 day SMA is anything but bearish. Thursday may tell that story. Or it might continue lower. A move down to 151, at the lower end of the channel and the lower Bollinger Band® still would not change the bullish story longer term. That would still be shy of a 4% drop, and gives it another $2 to move lower.
Below that the case for a bearish following improves but then the 50 day SMA shows up. This has acted as support often for the Nasdaq, and only the recent move up from late October has put some separation between price and it. A retest and hold would not be bearish but a buying opportunity. It would take a move below the 50 day and the October 26 low, filling the gap along the way, and breaching the 100 day SMA to create a more complete bearish case. That would also make for a better than 6% drop.
Momentum has shifted. The RSI is falling, but it remains in the bullish zone and over the mid line. The MACD is also crossing down. Both could use a reset lower, and continued movement lower could signal a deeper drop. But for now the one day fall is not epic or a meltdown. Just a sign that markets can go up and down. Pay attention for now.
The information in this blog post represents my own opinions and does not contain a recommendation for any particular security or investment. I or my affiliates may hold positions or other interests in securities mentioned in the Blog, please see my Disclaimer page for my full disclaimer.
