We have reached the end of the week and the Trade Wars still loom large over markets. Equity prices are pulling back in this headline driven world despite a barrage of good earnings reports. We have come to almost expect some crazy message from the White House when things get too quiet and this time did not disappoint.
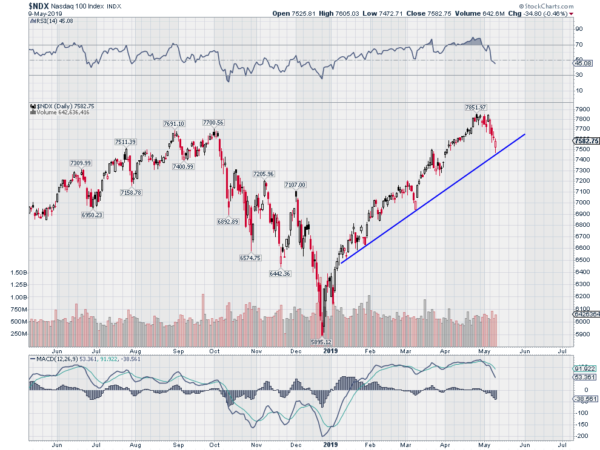
So how do you invest in this world? The same way you always did, follow the price action. And in the Nasdaq 100 there are some interesting developments. Take a look at the chart below. It shows the price action in the Nasdaq 100 Index over the past 12 months, Focusing on the right side of the chart shows the major uptrend since late December.

It is notable that since early January a rising trend support has been in place. The price had created some space above the trend since March and now is almost back to that trend support line. There is nothing magical about this line. There have been no battles between buyers and sellers there. It only holds our interest because it exists and price has reversed there in the past.
So will it reverse this time? We will have to wait and see. But there are some interesting aspects to the chart that accompany this price level. First is that the MACD has reset substantially lower, but remains positive. A reversal would show lots of room for upside. And the RSI has moved from overbought to under the mid line, but remains in the bullish zone. It is also below the bottom from the March drop, setting up for a possible Positive RSI Reversal. None of this will matter if the price continues to drop, but some reasons to watch more closely with the weekend approaching.
Disclaimer: The information in this blog post represents my own opinions and does not contain a recommendation for any particular security or investment. I or my affiliates may hold positions or other interests in securities mentioned in the Blog, please see my Disclaimer page for my full disclaimer.
