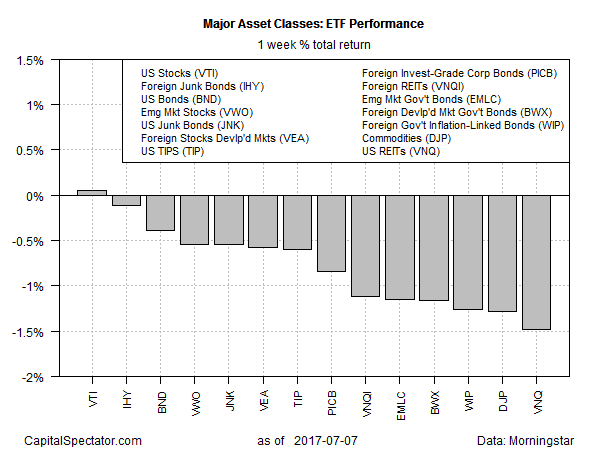
Red ink dominated the first week of trading in July. The main exception: equities in the US, which edged higher. Otherwise, across-the-board losses weighed on the major asset classes, based on a set of exchange-traded products.
US stocks bucked last week’s selling wave, albeit only slightly. Vanguard Total Stock Market (VTI) was fractionally higher, inching up six basis points. The rest of the field lost ground for the trading week through July 7.
The biggest loser: real estate investment trusts (REITs). Vanguard REIT (NYSE:VNQ) fell for a second straight week, dropping 1.5%.
The outlook for higher interest rates is a factor giving investors pause. “Central banks are likely to remain a key focus for investors this week, with the sudden hawkish shift among a number of them in recent weeks pushing bond yields higher and weighing on risk appetite,” Craig Erlam, a senior market analyst at Oanda, advised in a note. “While the impact of this hasn’t weighed too heavily on equity markets so far, it does appear to have taken the edge off the rally and may continue to do so in the coming months.”

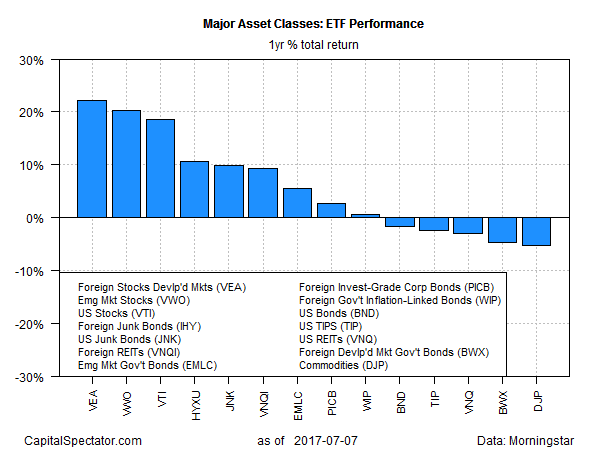
The recent headwind is taking a toll on one-year results too. Five of the 14 major asset classes are now in the red for trailing 12-month performance.
Broadly defined commodities continue to post the deepest one-year loss. iPath Bloomberg Commodity (NYSE:DJP) is off 5.2% as of July 7 vs. the year-earlier price.
On the flip side, stocks in developed-world markets (excluding the US) are the top performer. Vanguard FTSE Developed Markets (NYSE:VEA) is up a strong 22.2% for the year through last week’s close.

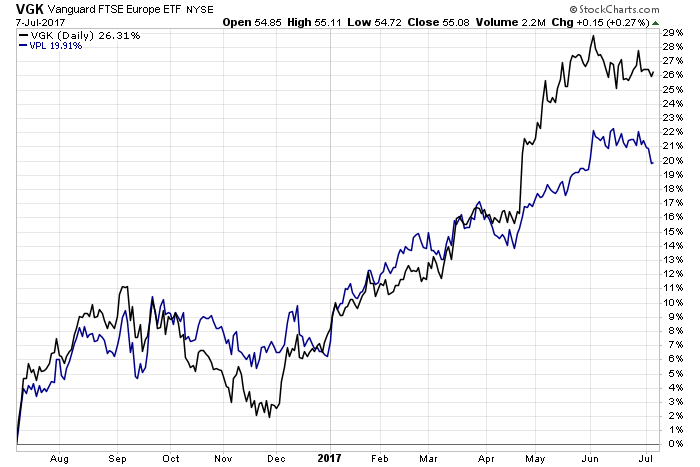
European equities are the main engine driving VEA higher in recent months. Vanguard FTSE Europe (NYSE:VGK) is up 26.3% on the year through Friday (black line in chart below). By comparison, Vanguard FTSE Pacific (NYSE:VPL) is ahead by a lighter 19.9%, based on performance data (blue line).

The question is whether the rally in Europe is sustainable. Bloomberg raises doubt by noting that “the second-quarter earnings season that’s about to kick off in Europe has a hard act to follow:
In the first three months of the year, profits increased by the most in more than six years, JPMorgan Chase & Co. estimates show. With equities now more expensive, investors are stressing the need for another solid quarter for the market to sustain its year-to-date gains.
