Current Position of the Market
S&P 500 Long-term trend: Uptrend continues.
S&P 500 Intermediate trend: The correction from 2400 continues,
Analysis of the short-term trend is done on a daily-basis with the help of hourly charts. It is animportant adjunct to the analysis of daily and weekly charts which discuss longer market trends.
Market Overview
The correction which started from 2400 is now a little over three weeks old, and should soon reach the halfway point of its duration. It is primarily causedby a group of intermediate cycles, with the last one bottoming in mid-May. However, it is conceivable that the actual low of the correction will be made three weeks sooner, when the most dominant of the three makes its low. In that case, the last cycle would only bring about a re-test of the low, or wave 2. We’ll just have to see how it allplays out.
The first cycle should reverse in a day or two. Friday’s action did not quite look like a completion, nor did S&P 500 squarely meet its projected target, but only flirted with it. It’s also possible that the projection will be slightly exceeded if a little more congestion occurs at the current level before we make the final low. The top pattern does provide for some extension of the count, if needed.
The first cycle should only give us the a-wave of an a-b-c pattern. After a b-wave rally, we could conclude the correction with the low of the next cycle, bringing a new low which will be made available to subscribers as soon as the confirming count of the b-wave has been established. If the second cycle low ends the correction with a c-wave, then the final cycle will most likely be the wave 2 of the new uptrend.
Daily chart
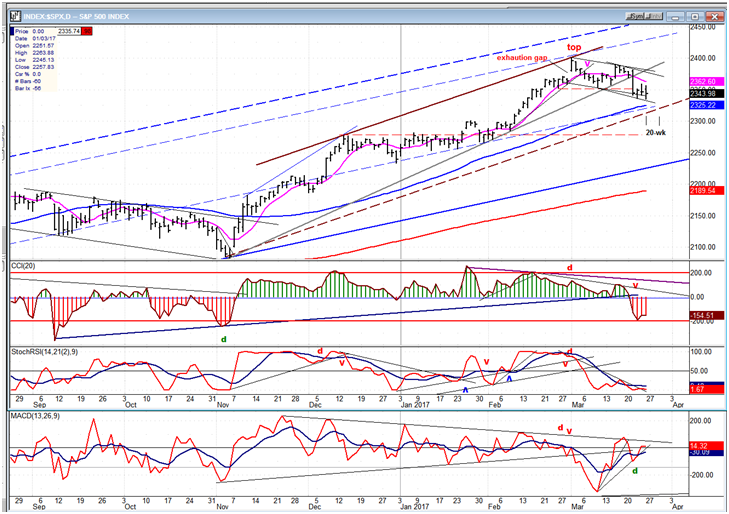
The uptrend that we are presently correcting started at 2084 and ended at 2400. It’s part of a longer uptrend which started at 1810, and it’s unlikely that the move to 2400 ended the entire span from that level. This is why I only expect this correction to be moderate, while the next one which will start from a new all-time high should be far more severe.
I have marked by two small vertical lines, the time frame which should produce a low of the 20-wk cycle. Although I believe that we have a little more downside risk, I suspect that the final print will be in the vicinity of the blue (55-d) moving average, and certainly not below it. Even though the chart shows that this low should produce the end of what looks like an a-b-c pattern from the top, it will not meet my expectations for the low of the correction.
The uptrend from 2084 fits well within a channel which has a heavy brown line for its top trend line, and a dashed line for the lower one which is a near-perfect parallel to the 55-d MA. Because of the current structure of the uptrend, I believe that, by the time the next cycle has made its low, the index will have breached both the MA and the channel line. I already have two potential counts for the end of the correction which I will disclose later on to subscribers.
The oscillators all demonstrate a readiness to turn. In fact, the A/D oscillator is already in an uptrendand displaying plenty of positive divergence, but that’s because on the first phase of the decline, it became very oversoldand reflected far more weakness than was shown by the price. Normally, when daily indicators turn, they bring about a decent rally, but this one will be curtailed by the much larger cycle which is alreadyin the process of bottoming. I won’t be able to estimate the extent of the rebound until the final low of the 20-wk cycle is made.
Hourly chart
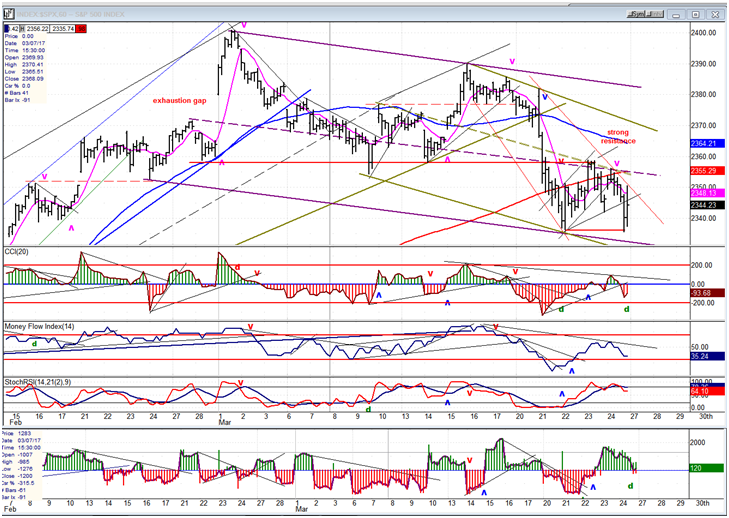
The entire correction is forming a primary (purple) channel which is not very steep and which, over the intermediate term, looks more like a consolidation than a correction. However, the greenish channel which represents the second phase of the correction currently underway is declining at a slightly steeper angle, and we may see even more downward acceleration develop during the last couple of weeks of the 67-wk cycle.
The steep portion of the second phase extended the total decline from 2400 to 65 points and brought the index to the bottom line of the purple channel. The two dashed lines denote the midpoint of the two channels. Their intersection formed a strong resistance level which stopped the bounce from the low and turned it back down. The retracement also measured .382 of the second phase decline.
Last Friday, the final two hours of trading saw a strong rebound from the level of the former near-term low of 2336. It stopped and pulled-back after hitting the minor thin, red downtrend line. Breaking that trend line should signal thatthe 20-wk cycle has made its low,that phase two of the correction is over, and that we are rallying in wave “b”, with the next down-phase possibly starting when we reach the top of the greenish channel.
But beforewe start the b-wave, there is a good chance that we will make another low. The re-test of the 2336 level gave us positive divergence in the indicators, but the second one from the bottom (SRSI) more often than not retraces to the bottom of its range before turning up.
An overview of some important indexes (Weekly charts)
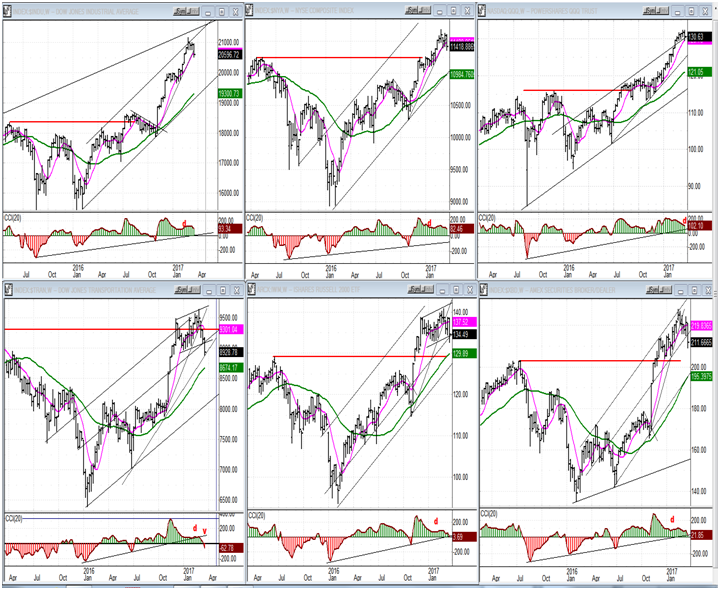
All indices are consolidating, with TRAN leading on the downside and IWM a close second (bottom left and center). TRAN is the only one which has given a sell signalthat could turn out to be a long-term sell signal if it does not make more upside progress over the next few months. This is by far the weakest index. The recent decline has brought it back down below the 10/15 top (red line). We should keep in mind that it anticipated the last important top (5/16) by three months, and may again be gving us a warning far in advance!
PowerShares DB US Dollar Bullish (NYSE:UUP)
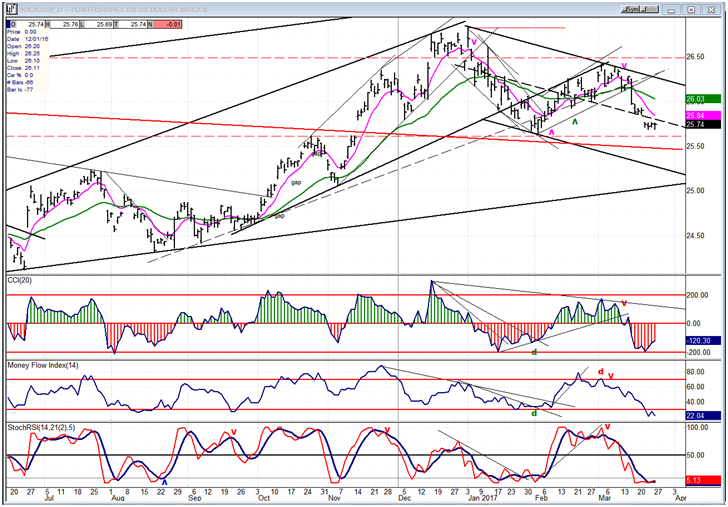
The dollar continues to correct after gapping below its mid-channel trend line. The oversold condition of its indicators suggests that a reversal may be fairly close.
GDX (Gold Miners ETF (NYSE:GDX))
In spite of the bottoming of important cycles in early March, GDX’s recovery has stalled and it looks ready to pull back. The correction could extend into mid-May, when the next important cycle low is due.
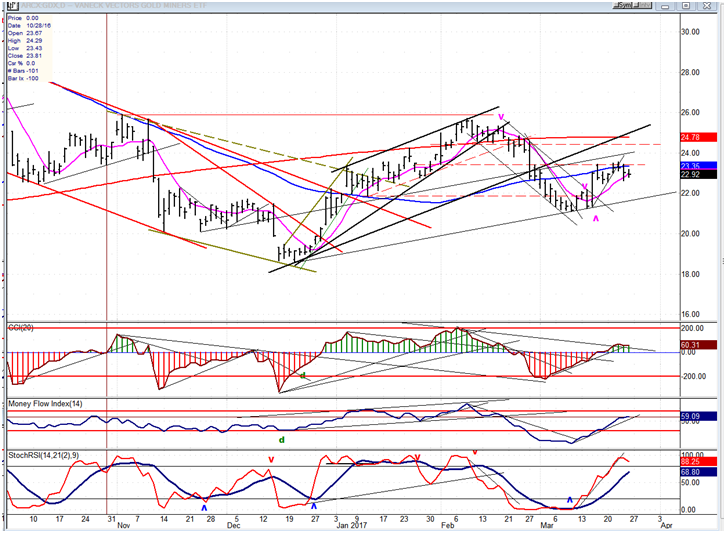
Note: GDX is now updated for subscribers throughout the day, along with S&P 500.
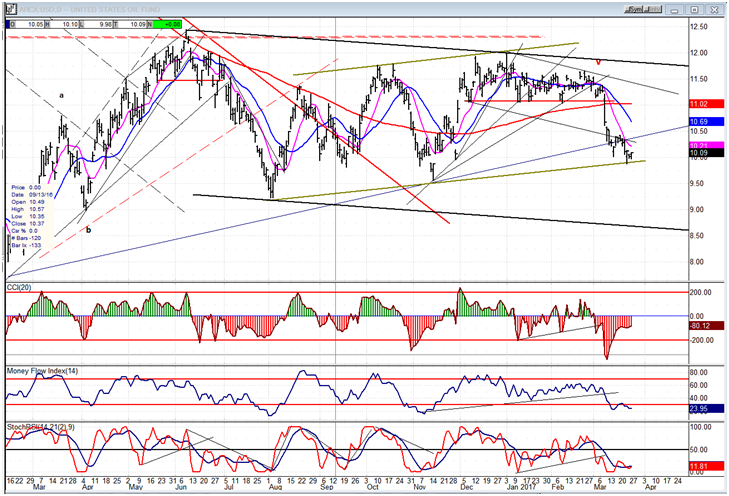
USO (NYSE:USO) (U.S. Oil Fund)
USO’s indicators tell us that it has completed its short-term downtrend and may be ready to bounce. If it can’t make some real headway on this move, the next one could drive it to the bottom of the larger correction channel.
Summary:
The 20-wk cycle had the effect on the market which was expected of it. While there should be a temporary reprieve in the correcting process as this cycle reverses, the 67-wk cycle (whose low is due in a few weeks) should extend the correction and bring about a new low. It is too soon to knowif the final third intermediate cycle will prolong the correction, or simply cause a re-test of the 67-wk cycle low.
