Monitoring purposes SPX: Long SPX on 6/25/15 at 2102.31.
Monitoring purposes GOLD: Flat
Long Term Trend monitor purposes: Flat

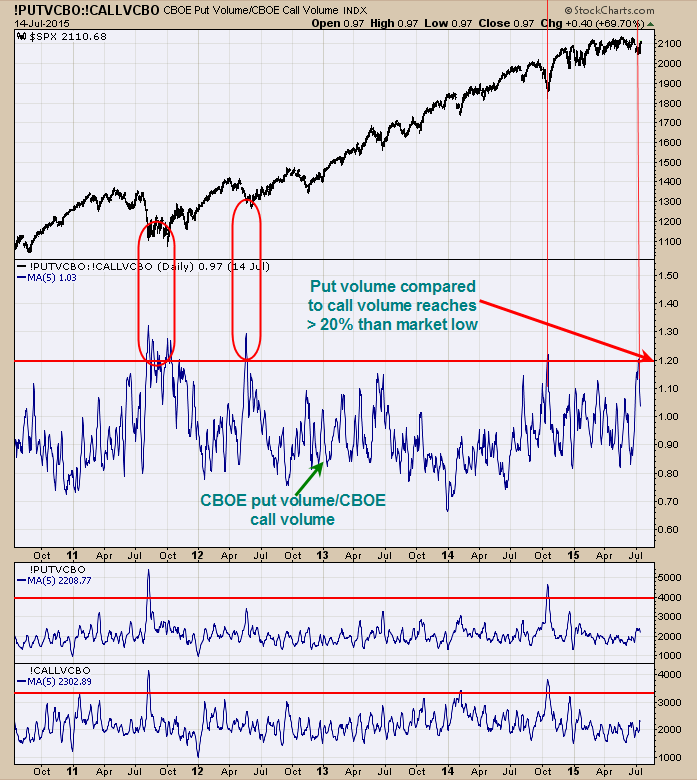
The middle window in the chart above is the CBOE put volume/CBOE call volume. The CBOE put/call volume ratio becomes extreme when it reaches above 1.20, or in other words, when put volume is higher than call volume by 20% or more. This chart goes back five years and shows the times when this put/call volume ratio reached above 1.20, and as you can see, at the last low, it reached this level. Precious times when this ratio reached above 1.20, the market was at an important low.

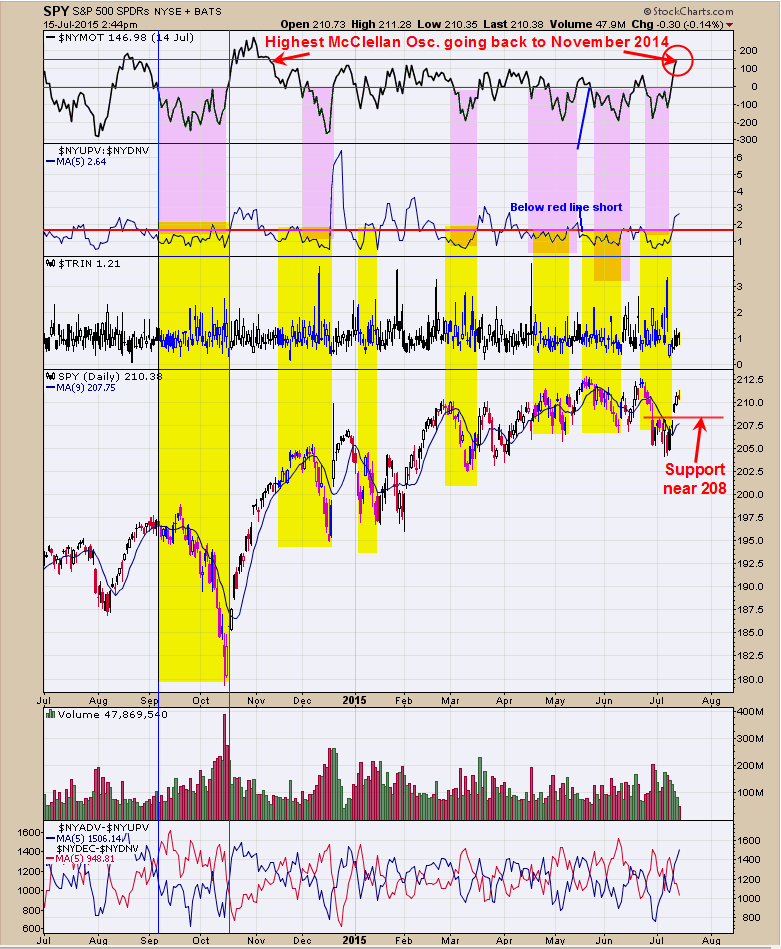
Yesterday, the McClellan Oscillator closed at + 146.98 and the highest reading since November 2014. Normally, the higher the McClellan Oscillator, the more bullish the following trend, and with yesterday's high Oscillator reading, this suggests the choppy trend from January 2015 may be ending. We are not ruling out a pull back to the 208 gap range on the ARCA:SPY, but that area should hold, as the high McClellan Oscillator reading suggests strength in the market, and new highs may be seen soon. On yesterday’s report, we pointed out possible bearish development in the Bullish Percent index not reaching above 65%, and the McClellan Summation index not getting above +500 on the current rally phase. The current high reading in the McClellan Oscillator suggest the Bullish Percent index will get above 65% and the McClellan Summation index will get above +500, keeping the bigger trend bullish. We don’t need to make those decisions right now, as the current rally phase is just starting and could last awhile. We are long the SPX on 6/25/15 close at 2102.31.

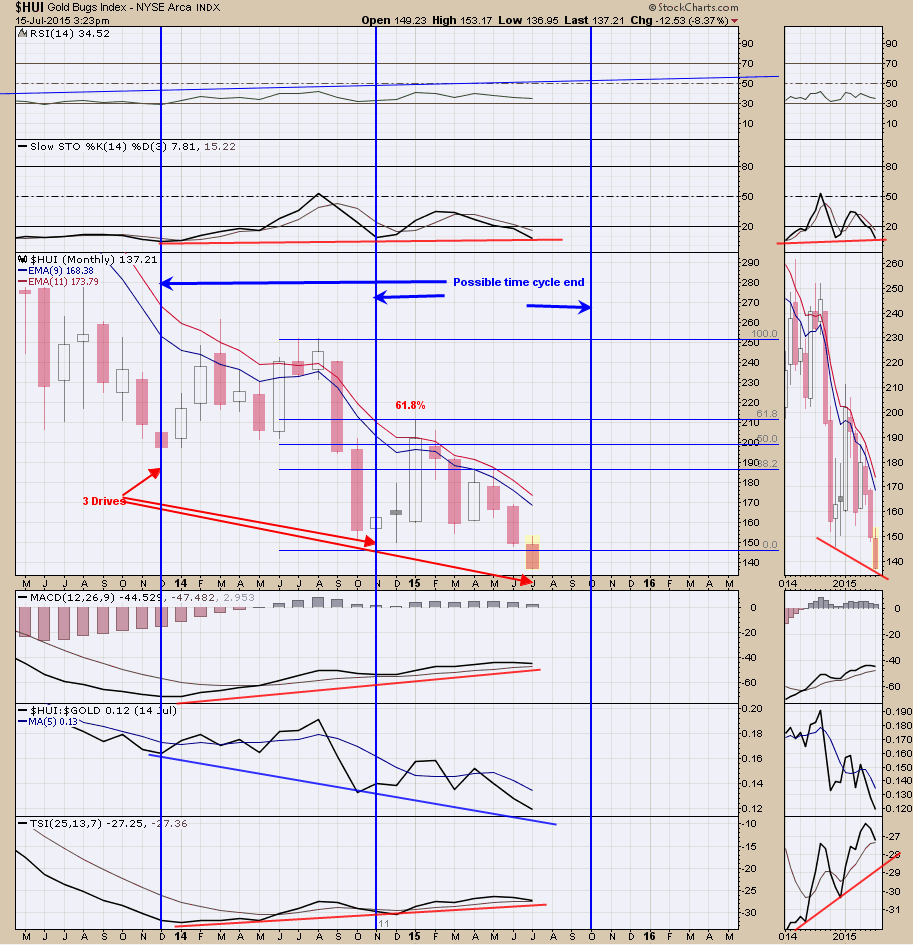
We have been watching for a possible “Three Drives to a Bottom” form on HUI along with ARCA:GDX, and so far, that possibility is still alive. I have drawn cycle lines on HUI at the previous bottom of December 2013 and November 2014, and if the time distance remains intact, then the next low may form in October 2015. There is a monthly cycle for a low due in August, which could arrive early or late, and the October timeframe could work out. So far, the momentum remains down, but there are still positive divergences in the monthly RSI, Slow Stochastics, MACD and the True Strength index. A monthly Close above 9 and 11 period moving average near 175 on the HUI would turn the trend back to bullish. At previous important lows, the “Commitment of Traders report” showed the small Speculators in a short position, and the 7/3/15 report showed they were net long over 7K, and the 7/10/15 report showed near 3K long. Not in a short position yet, but appears to be heading that way. No bottom signal yet. Next couple of months could be important for the gold market; still neutral for now.
