It’s tempting to say that miners are showing strength compared to gold based on the VanEck Vectors Gold Miners ETF's (NYSE:GDX) performance, but other mining proxies say otherwise.
Just because a house is standing doesn't mean its foundations are solid, and that's exactly the case with the miners.
There’s one extra thing that I would like to point out about mining stocks’ technical picture today (April 8), and that’s their performance relative to gold.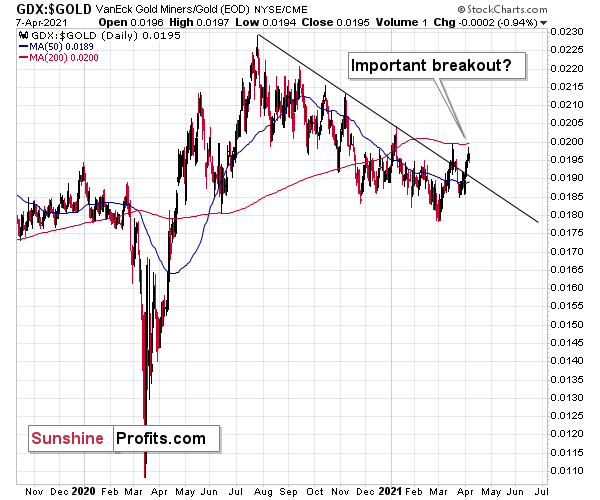
Some investors might say that mining stocks are showing strength compared with gold as the GDX-to-gold ratio broke above its declining resistance line.
However, I don’t think it’s fair to say so. I think that seeing a breakout in the GDX-to-gold ratio is not enough for one to say that the miners-to-gold ratio is breaking higher.
After all, the GDX ETF is just one proxy for mining stocks, and if miners were really showing strength here, one should also see it in the case of other proxies for the mining stocks when compared to gold.
For instance, the HUI Index-to-gold ratio, the XAU Index-to-gold ratio, and the VanEck Vectors Junior Gold Miners ETF (NYSE:GDXJ) ( junior mining stocks ) to gold ratio.
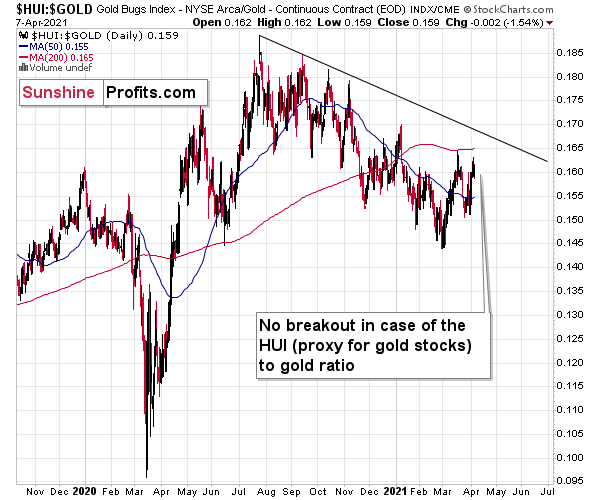
There is no breakout in the HUI-to-gold ratio whatsoever. In fact, the ratio is quite far from its declining resistance line. Even if we chose other late-2020 tops to draw this line, there would still be no breakout.
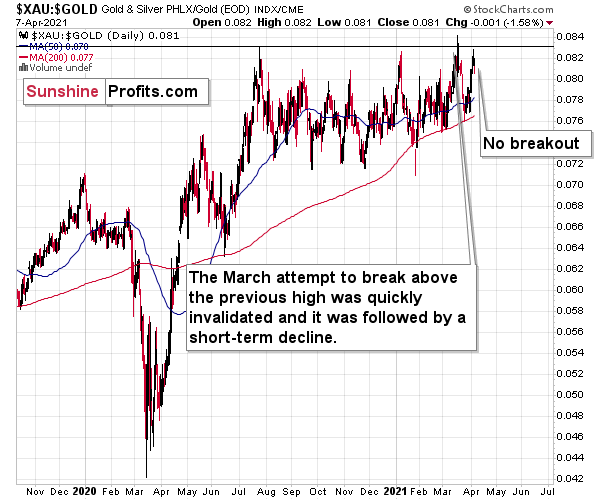
There is no breakout in the XAU-to-gold ratio either. The previous attempts for the XAU-to-gold ratio to rally above their 2020 high marked great shorting opportunities, which is very far from being a bullish implication.
But the most bearish implication comes from gold’s ratio with another ETF – the VanEck Vectors Junior Gold Miners ETF (NYSE:GDXJ).
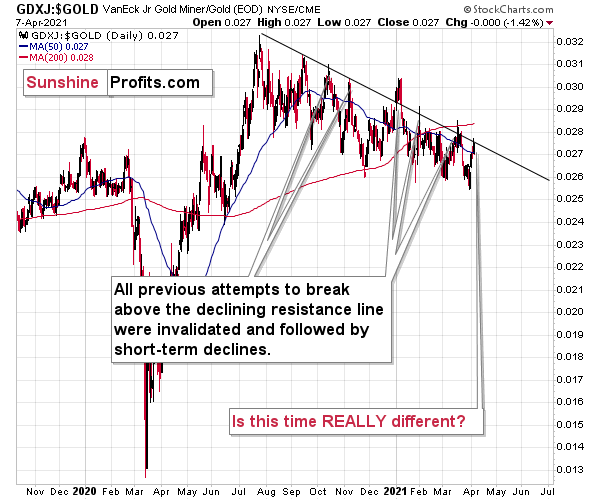
The GDXJ-to-gold ratio actually provides a sell signal, as the tiny breakout above the declining resistance line was already invalidated.
Five out of five previous attempts to break above the declining resistance line failed and were followed by short-term declines. Is this time really different?
It seems to me that the five out of five efficiency in the GDXJ-to-gold ratio is more important than a single breakout in the GDX-to-gold ratio, especially considering that it was preceded by a similar breakout in mid-March. That breakout failed and was followed by declines.
Taking all four proxies into account, it seems that the implications are rather neutral to bearish. Especially when taking into account another major ratio - the one between ARCA Gold BUGS and S&P 500 is after a major, confirmed breakdown.
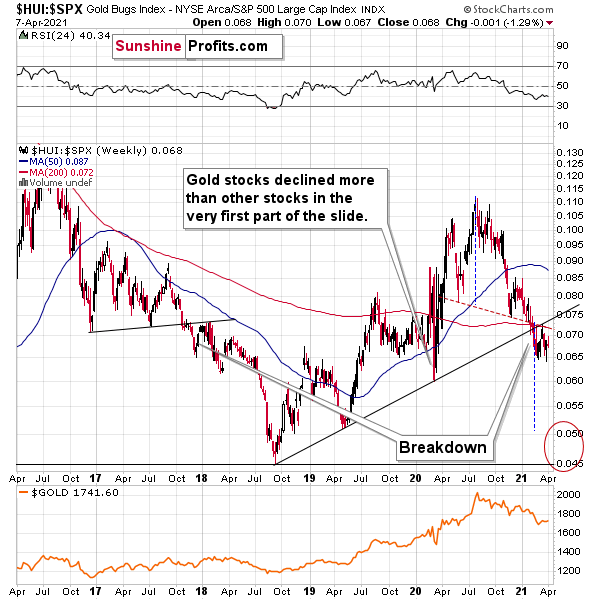
All in all, the implications of mining stocks’ relative performance to gold and the general stock market are currently bearish.
