We’ve been very bullish on the miners since January but became concerned recently with the poor technical action in the metals (specifically Gold). Last month the mining indices were very close to a major breakout yet couldn’t punch through. This signaled that Gold could begin a deeper decline and the miners would be vulnerable. However, Gold failed to break below $1280 while the miners have continued to digest their early summer gains and hold support. In addition, Gold is showing increasing relative strength amid USD strength and equity market weakness. If Gold continues to show this kind of relative strength in the weeks ahead then it raises the odds that the miners will break to the upside in September.
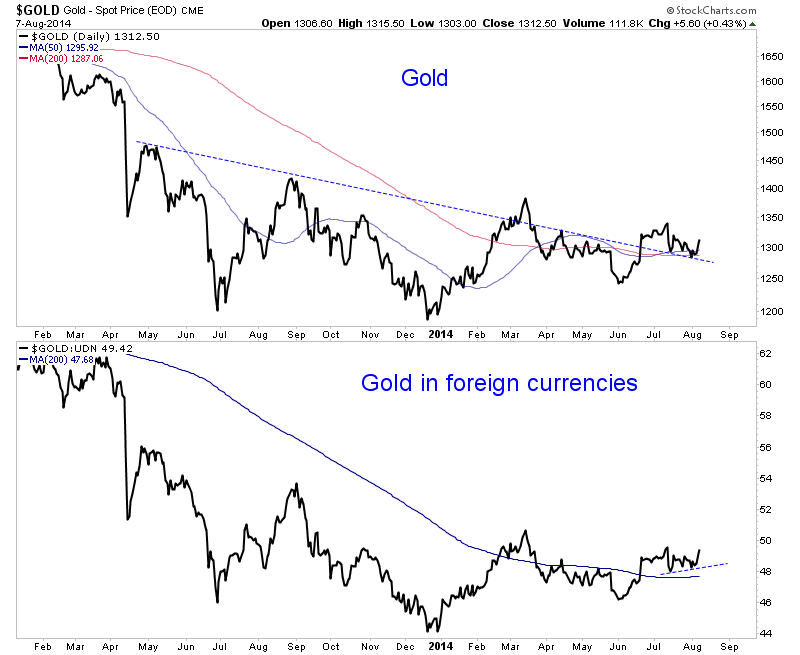
Usually I prefer to focus on the miners as they lead the metals at key turning points. However, I want to present a few charts that focus on Gold. Below we plot Gold and Gold against foreign currencies (using the PowerShares db USD Index Bearish (NYSE:UDN) ETF). We see that Gold is gaining strength against foreign currencies. It’s inches away from a five month high. Moreover, during recent weakness that chart never threatened its 200-day moving average which is starting to slope upward. Gold in US$ is not quite as strong but appears to be following the other chart which made its low in mid July.
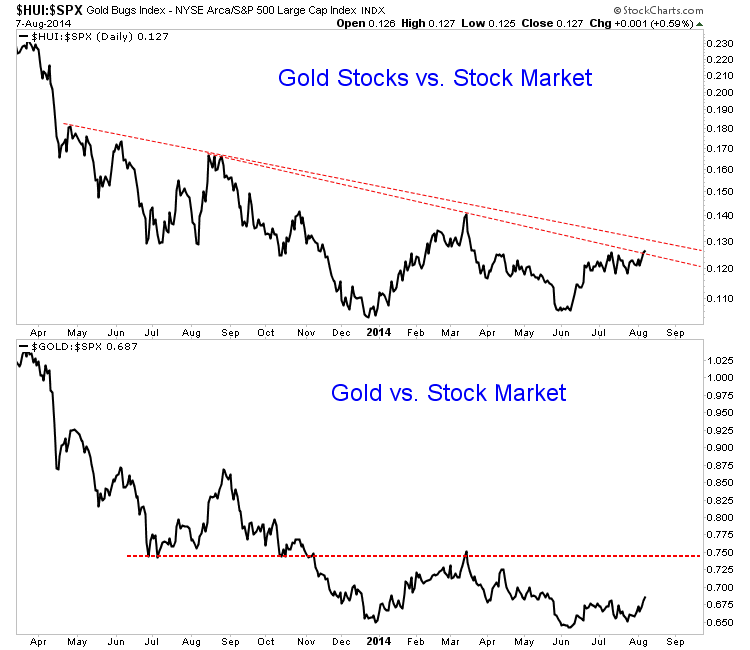
Another very important ratio to watch is Gold against the S&P 500. These two markets have had a strong negative correlation since three years ago. Whenever equities perform well it puts pressure on Gold. For many years in the 1970s as well as 2000 through 2002, Gold performed well when equities did not. We need to remember that Gold is an anti-conventional type of investment or speculation. Gold has trended sharply lower in recent years against both equities and bonds. If inflation expectations rise, capital will move out of those conventional asset classes and Gold would definitely benefit.
In the chart below we plot gold stocks against the stock market as well as Gold against the stock market. The HUI/SPX ratio closed at a five month high today. If one looks at a very long-term chart they’d conclude its possible the ratio made a double bottom in December and June. Meanwhile, the Gold/SPX ratio hit a three-month high today. If that ratio advances beyond 0.75 then it’s an undeniable trend change.
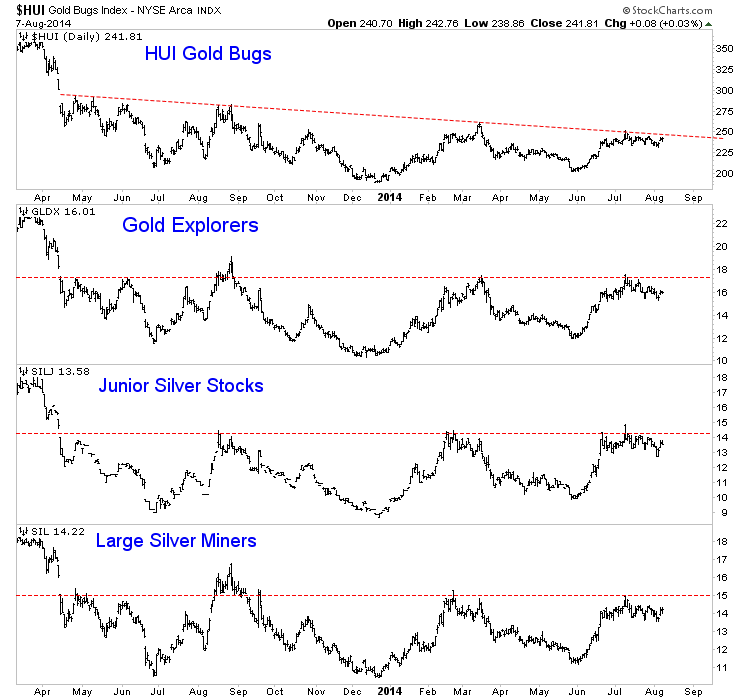
Elsewhere, the gold and Silver miners have held up well but remain in a consolidation. While they have bounced in recent days, odds favor more consolidation rather than an imminent breakout. Perhaps they touch resistance before pulling back. The miners, even in the bullish scenario probably need more time to consolidate and digest the very sharp gains from earlier in the summer.
Over the coming days and weeks I’ll be watching if Gold can push above $1320 and if it can maintain its relative strength against currencies, equities and commodities. (Gold is not far from a nine month high against commodities). In addition, I want to see the miners maintain strength against the metals. While Silver has been very weak, the silver stocks (NYSE:SIL) and SILJ) are at 18-month highs relative to Silver.
This is a very interesting time for the precious metals complex which could be weeks away from a major breakout opportunity. Breakouts have often occurred in September so we should be patient. If the stocks break up out of their long bottoming formations then huge upside lies ahead and it will confirm that the sector is back in bull market mode. Investors won’t have to trade in and out of positions as much as they had to over the last 12 months. We are positioned with a bullish bias and ready to tweak that as we get more evidence and hints ahead of the next big move.

