Mind The Exuberance Gap

Published 11/22/2020, 01:40 AM
Updated 07/09/2023, 06:31 AM
XAU/USD
-
US500
-
DX
-
GC
-
GLD
-
BTC/USD
-
BTC/USD
-

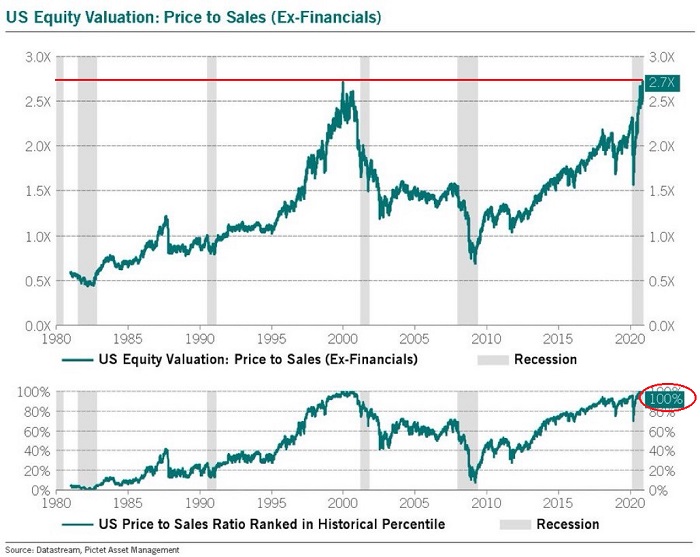
The investment community is not only willing to look beyond virus vaccination to economic nirvana, it is also willing to ignore extraordinary stock overvaluation. Consider the price-to-revenue metric. At 2.7x corporate sales, stocks have never been frothier.
Price To Sales Chart

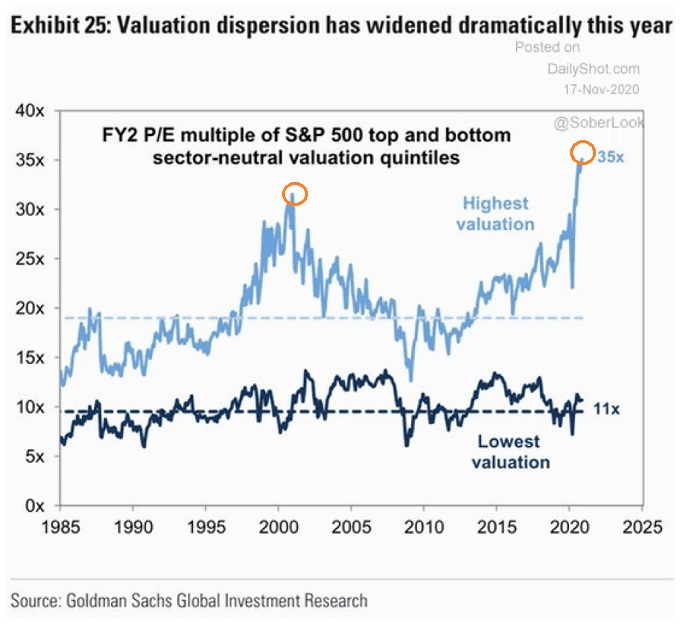
Another way to dissect the frothiness? Forward price-to-earnings ratios for the highest valuation quintile and the lowest valuation quintile.

Typically, investors might pay 20x for growth-oriented companies versus 10x for value-oriented companies. Today? Investors are coughing up an obscene 35x for bubbly mega-cap growth exposure. That is a higher P/E multiple than what we witnessed at the height of 2000’s infamous stock bubble.
Valuation Dispersion

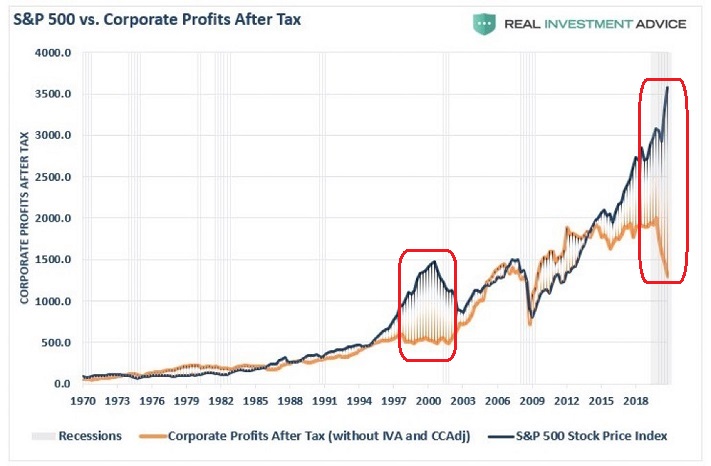
Historically, stock prices used to correlate with after-tax corporate profits. Then came the unchecked euphoria of the late 1990s. Eventually, though, dot-com infatuation led to the popping of the 2000 balloon.

Perhaps ironically, the 2020 gap between after-tax corporate profits and S&P 500 stock prices has widened to an even greater extent. If what the world witnessed back in 2000 represented peak insanity, what does 2020 represent?
S&P 500 Vs Corporate After Tax Profits

Can analysts as well as the media rationalize the price movement? They can and they do. Fiscal stimulus (e.g., forgiveness loans, direct household payments, etc.) and Federal Reserve stimulus (e.g., electronic money printing, asset purchasing, rate suppression, etc.) are far more critical for inflating asset prices than pesky valuation metrics.

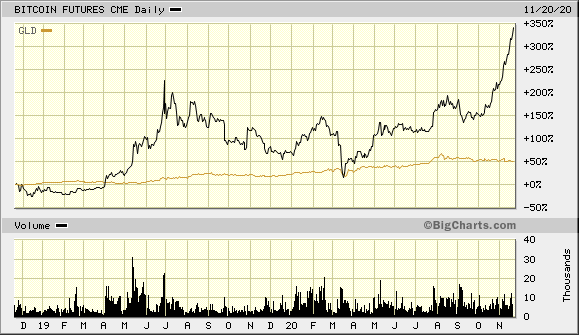
Then again, there may be significant repercussions for central bank rate manipulation, deficit spending and money printing. How much higher will inflation hedges like gold (SPDR® Gold Shares (NYSE:GLD)) and Bitcoin (BTC/USD)) rise, while the dollar sinks toward an abyss?
Gold And Bitcoin Daily Chart

Latest comments

Loading next article…
Risk Disclosure: Trading in financial instruments and/or cryptocurrencies involves high risks including the risk of losing some, or all, of your investment amount, and may not be suitable for all investors. Prices of cryptocurrencies are extremely volatile and may be affected by external factors such as financial, regulatory or political events. Trading on margin increases the financial risks.
Before deciding to trade in financial instrument or cryptocurrencies you should be fully informed of the risks and costs associated with trading the financial markets, carefully consider your investment objectives, level of experience, and risk appetite, and seek professional advice where needed.
Fusion Media would like to remind you that the data contained in this website is not necessarily real-time nor accurate. The data and prices on the website are not necessarily provided by any market or exchange, but may be provided by market makers, and so prices may not be accurate and may differ from the actual price at any given market, meaning prices are indicative and not appropriate for trading purposes. Fusion Media and any provider of the data contained in this website will not accept liability for any loss or damage as a result of your trading, or your reliance on the information contained within this website.
It is prohibited to use, store, reproduce, display, modify, transmit or distribute the data contained in this website without the explicit prior written permission of Fusion Media and/or the data provider. All intellectual property rights are reserved by the providers and/or the exchange providing the data contained in this website.
Fusion Media may be compensated by the advertisers that appear on the website, based on your interaction with the advertisements or advertisers.
© 2007-2025 - Fusion Media Limited. All Rights Reserved.