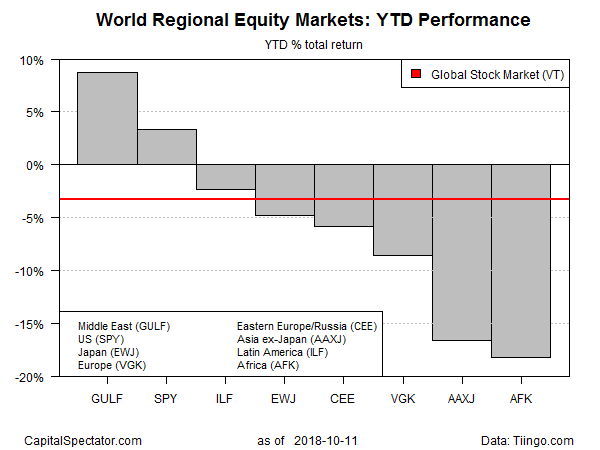
The global selloff in stock markets around the world this week has left equities in the Middle East and the US with the world’s only year-to-date gains for the major regions, based on a set of exchange-traded funds through yesterday’s close (Oct. 11).
WisdomTree Middle East Dividend (GULF) remains in the lead with an 8.7% year-to-date total return. Although the ETF has fallen sharply from its previous peak in August, the fund is still comfortably ahead of the field.
The US equity market, despite a sharp haircut this week, is still in second place, posting the only other year-to-date gain for the world’s major equity regions. SPDR S&P 500 SPY is reporting a modest 3.3% total return so far for 2018, although that is also well below the recent year-to-date results in the wake of the latest selling.
The world’s other equity regions are in the red this year. African stocks are currently suffering the biggest loss for 2018: VanEck Vectors Africa (AFK) is off 18.2% year to date.
As a reference point, a global equity benchmark via Vanguard Total World Stock (VT) is also down this year with a moderate 3.3% loss in 2018 through Oct. 11.

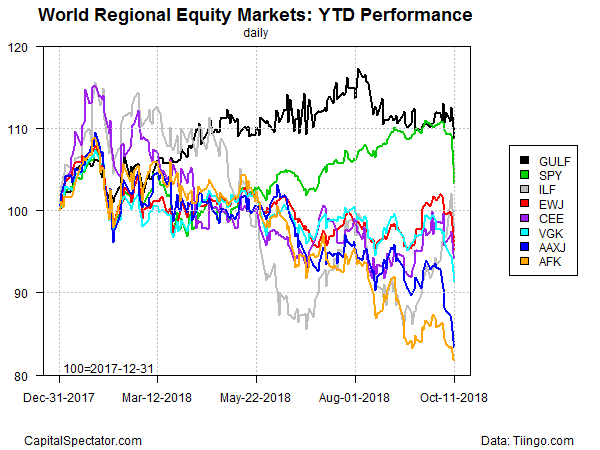
As the next chart shows, no corner of global markets was spared in the wave of selling this week. But optimists are cautiously pointing to today’s rebound in Europe and Asia as a possible sign that the worst may have passed.

“There could be more risk reduction into the weekend as investors position more defensively,” Stephen Innes at Oanda Corp. wrote in a note. “But this does offer a significant window of opportunity for the not so meek of heart.”
“Some traders are cautiously buying back into the market today, but the underlying issues which brought about the sell-off are still relevant,” advises David Madden, markets analyst at CMC Markets in London.
Another analysis is looking for a degree of firming in US stocks. “We’re certainly expecting a bounce in the short term,” wrote Justin Waltes, co-founder of research firm Bespoke Investment Group, in a report published yesterday.
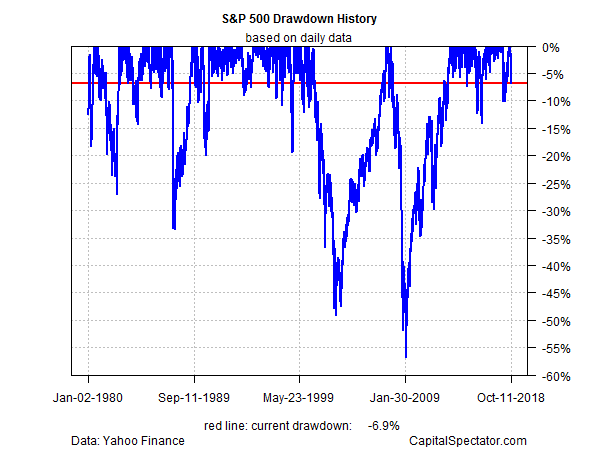
Meantime, the drawdown for the S&P 500 tumbled to -6.9% at yesterday’s close, the deepest since early May.

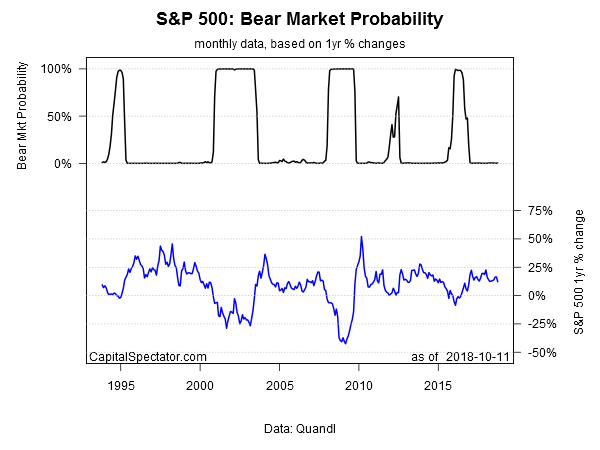
Nonetheless, an econometric estimate of bear-market risk for the stock market in the US has yet to flash red (based on a Hidden Markov model, as outlined here).

“The sharp sell-off we are seeing in the market has left a lot of folks wondering if this is the beginning of the end. Investors shouldn’t panic,” Christopher Smart, head of macroeconomic and geopolitical research at Barings, told CNBC yesterday. “So far, it has the feel of a temporary correction that will take some of the excess air out of tech stocks.”
