Mid Cap Funds Begin To Join Large Caps With Significant Outflows

Published 03/28/2017, 01:47 AM
Updated 05/14/2017, 06:45 AM
US500
-
US2000
-
RMD
-
IJH
-
IWM
-
RJF
-
SNPS
-
MDY
-
XMLV
-
CDK
-

We have seen some end-of-the quarter profit taking in Large and Mid-Cap equities, at least evidenced by the flows in ETFs. In contrast, we’re seeing noticeable inflows into Small-Cap Equities via IWM (NYSE:IWM) (iShares Russell 2000), Expense Ratio 0.20%.

Today, we would like to point out the $700 million and $400 million respectively that has vacated MDY (NYSE:MDY) (SPDR S&P Midcap 400, Expense Ratio 0.25%) and IJH (NYSE:IJH) (iShares Core S&P Mid-Cap, Expense Ratio 0.07%).

IJH has over $38 billion in assets under management, while MDY is the second largest Mid-Cap ETF behind it with $19.5 billion. So while recent redemptions are certainly not gigantic in size, they’re still notable nonetheless given the year-to-date underperformance MidCaps have displayed versus the Large-Cap S&P 500 (trailing by nearly 300 basis points YTD).

Both funds are market-capitalization weighted of course, but well diversified in that the top weighted holding in IJH (WWAV) only consumes 0.59% of the portfolio. Other top holdings are as follows: RMD (NYSE:RMD) (0.58%), SNPS (NASDAQ:SNPS) (0.58%), RJF (NYSE:RJF) (0.58%), and CDK (NASDAQ:CDK) (0.57%).

We have mentioned XMLV (NYSE:XMLV) (PowerShares S&P MidCap Low Volatility Portfolio, Expense Ratio 0.25%, $60 million in inflows YTD) as having potential in this space as well, and it appears that it has not gone unnoticed as the fund now has a notable $954 million in AUM.
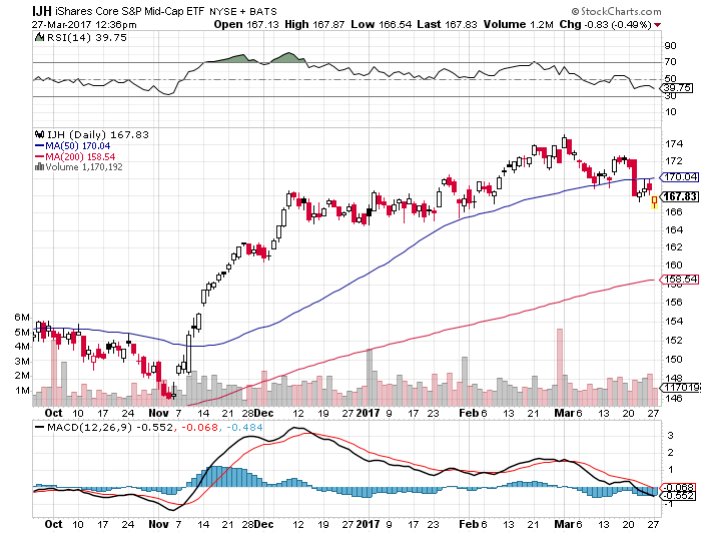
IJH Daily Chart

The iShares Core S&P Mid Cap ETF was trading at $168.23 per share on Monday afternoon, down $0.43 (-0.25%). Year-to-date, IJH has gained 1.75%, versus a 4.55% rise in the benchmark S&P 500 index during the same period.

IJH currently has an ETF Daily News SMART Grade of A (Strong Buy), and is ranked #1 of 25 ETFs in the Mid Cap Blend ETFs category.

Latest comments

Loading next article…
Risk Disclosure: Trading in financial instruments and/or cryptocurrencies involves high risks including the risk of losing some, or all, of your investment amount, and may not be suitable for all investors. Prices of cryptocurrencies are extremely volatile and may be affected by external factors such as financial, regulatory or political events. Trading on margin increases the financial risks.
Before deciding to trade in financial instrument or cryptocurrencies you should be fully informed of the risks and costs associated with trading the financial markets, carefully consider your investment objectives, level of experience, and risk appetite, and seek professional advice where needed.
Fusion Media would like to remind you that the data contained in this website is not necessarily real-time nor accurate. The data and prices on the website are not necessarily provided by any market or exchange, but may be provided by market makers, and so prices may not be accurate and may differ from the actual price at any given market, meaning prices are indicative and not appropriate for trading purposes. Fusion Media and any provider of the data contained in this website will not accept liability for any loss or damage as a result of your trading, or your reliance on the information contained within this website.
It is prohibited to use, store, reproduce, display, modify, transmit or distribute the data contained in this website without the explicit prior written permission of Fusion Media and/or the data provider. All intellectual property rights are reserved by the providers and/or the exchange providing the data contained in this website.
Fusion Media may be compensated by the advertisers that appear on the website, based on your interaction with the advertisements or advertisers.
© 2007-2025 - Fusion Media Limited. All Rights Reserved.