🐂 Not all bull runs are created equal. November’s AI picks include 5 stocks up +20% eachUnlock Stocks

Microsoft Reaching Extreme Area

Published 08/16/2017, 06:37 AM
Updated 03/09/2019, 08:30 AM
MSFT
-
AMZN
-
NSEI
-

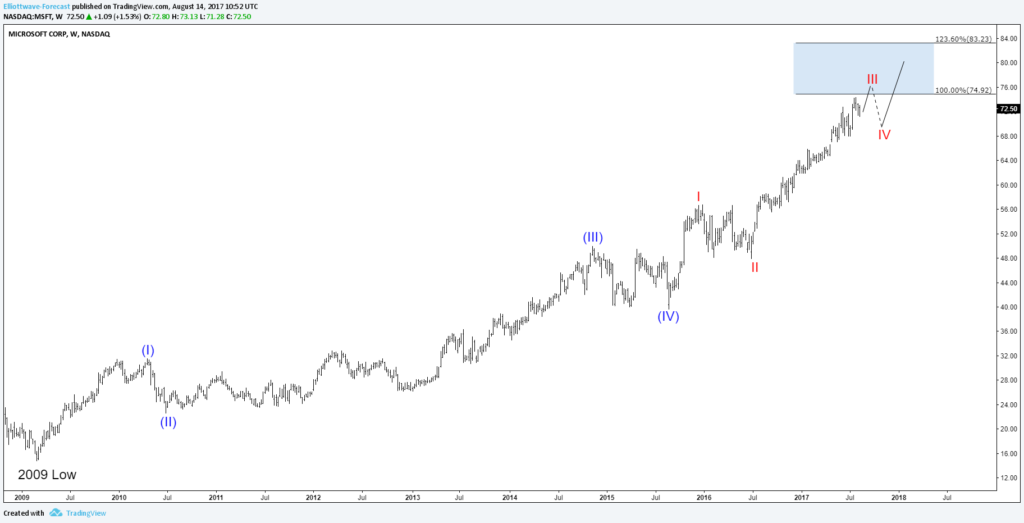
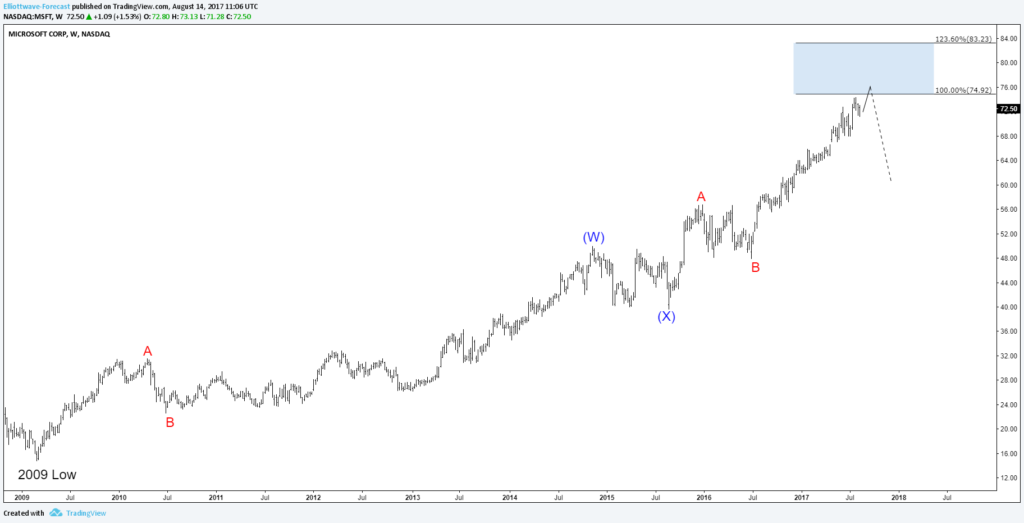
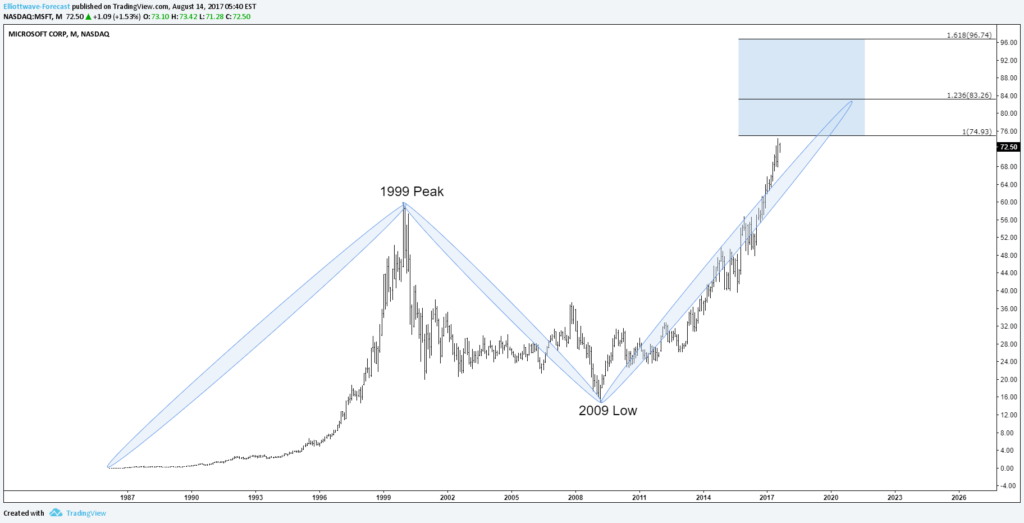
Microsoft stock (NASDAQ: NASDAQ:MSFT) is showing 3 swings from all time lows and approaching the equal legs area ( 75 – 96 ) where a correction can be seen, but the move from 2009 low could still extend further if it’s the 3rd wave of an impulsive 5 waves move that’s why it’s not recommended to sell it despite it’s reaching a multi-year extreme area.

Microsoft Monthly Chart

The cycle from 2009 low can be counted as an impulsive move with an extended 5th wave which still needs to end wave III then a pullback in IV before a final rally to end that cycle. This scenario is supporting more upside into the blue box area 74.92 – 83.23 and suggesting that pullbacks can still be bought in 3 , 7 or 11 swings.

Microsoft Daily Chart ( 5 waves )
Microsoft Weekly Chart

The second scenario is suggesting that MSFT is doing a double three 7 swings structure which also will be reaching equal legs area 74.92 – 83.23 and from there a pullback is expected to happen to correct that cycle.

Microsoft Daily Chart ( 7 swings )
Microsoft Weekly Chart

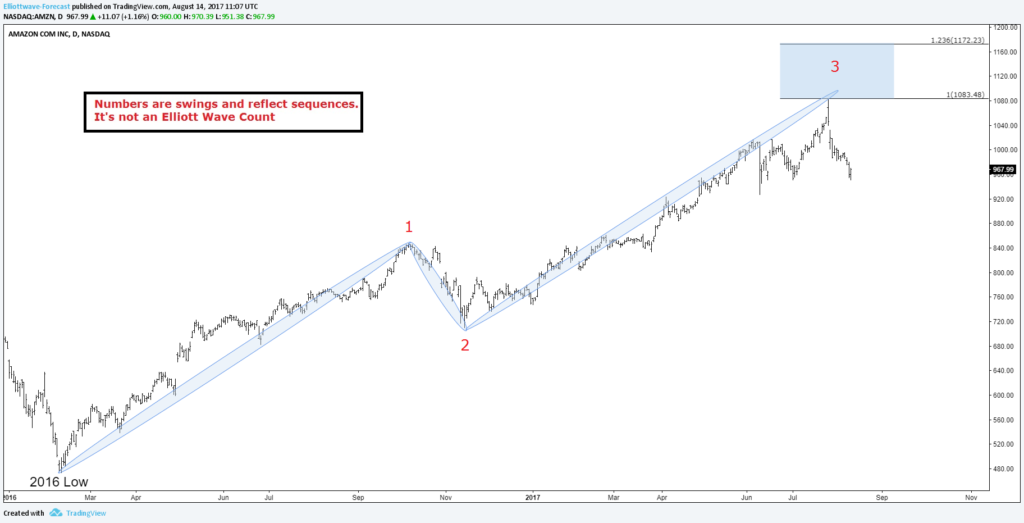
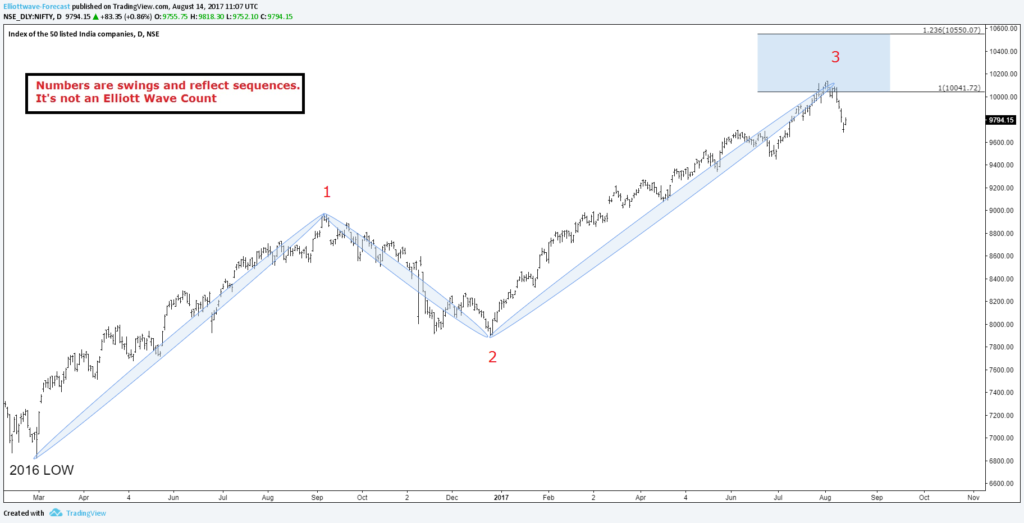
Consequently, both scenario presented above are indicating that Microsoft is reaching an important extreme area that could put pressure on the stock and produce a correction from there later on. Adding to that, we have Amazon (NASDAQ:AMZN) stock and Nifty Index reached equal legs area from 2016 low which means that cycle is in bonus time if not already ended that’s why we need to be careful about chasing the long side in the stock market.

Amazon Daily Chart
Amazon Daily Chart

Nifty 50 Daily Chart
NIFTY Daily Chart

Recap

Microsoft is one of the strongest companies and it’s heavily correlated to Nasdaq which already reached a similar area, so if we combine both instrument then we notice that there could be a choppy time ahead for the technology sector which will be also reflected on the rest of the market.

Latest comments

Loading next article…
Risk Disclosure: Trading in financial instruments and/or cryptocurrencies involves high risks including the risk of losing some, or all, of your investment amount, and may not be suitable for all investors. Prices of cryptocurrencies are extremely volatile and may be affected by external factors such as financial, regulatory or political events. Trading on margin increases the financial risks.
Before deciding to trade in financial instrument or cryptocurrencies you should be fully informed of the risks and costs associated with trading the financial markets, carefully consider your investment objectives, level of experience, and risk appetite, and seek professional advice where needed.
Fusion Media would like to remind you that the data contained in this website is not necessarily real-time nor accurate. The data and prices on the website are not necessarily provided by any market or exchange, but may be provided by market makers, and so prices may not be accurate and may differ from the actual price at any given market, meaning prices are indicative and not appropriate for trading purposes. Fusion Media and any provider of the data contained in this website will not accept liability for any loss or damage as a result of your trading, or your reliance on the information contained within this website.
It is prohibited to use, store, reproduce, display, modify, transmit or distribute the data contained in this website without the explicit prior written permission of Fusion Media and/or the data provider. All intellectual property rights are reserved by the providers and/or the exchange providing the data contained in this website.
Fusion Media may be compensated by the advertisers that appear on the website, based on your interaction with the advertisements or advertisers.
© 2007-2024 - Fusion Media Limited. All Rights Reserved.