
Further evidence that the US and China are bridging the gaps in structural differences via a multitude of headlines, alongside a tweet from US President Trump that the March 1st tariff increase will be delayed as he plans a summit with China's President Xi, was at the epicenter reinvigorating 'true risk on' microflows. This leaves an environment where exploitable sell-side opportunities against the likes of the Japanese yen and the US dollar should still be found.
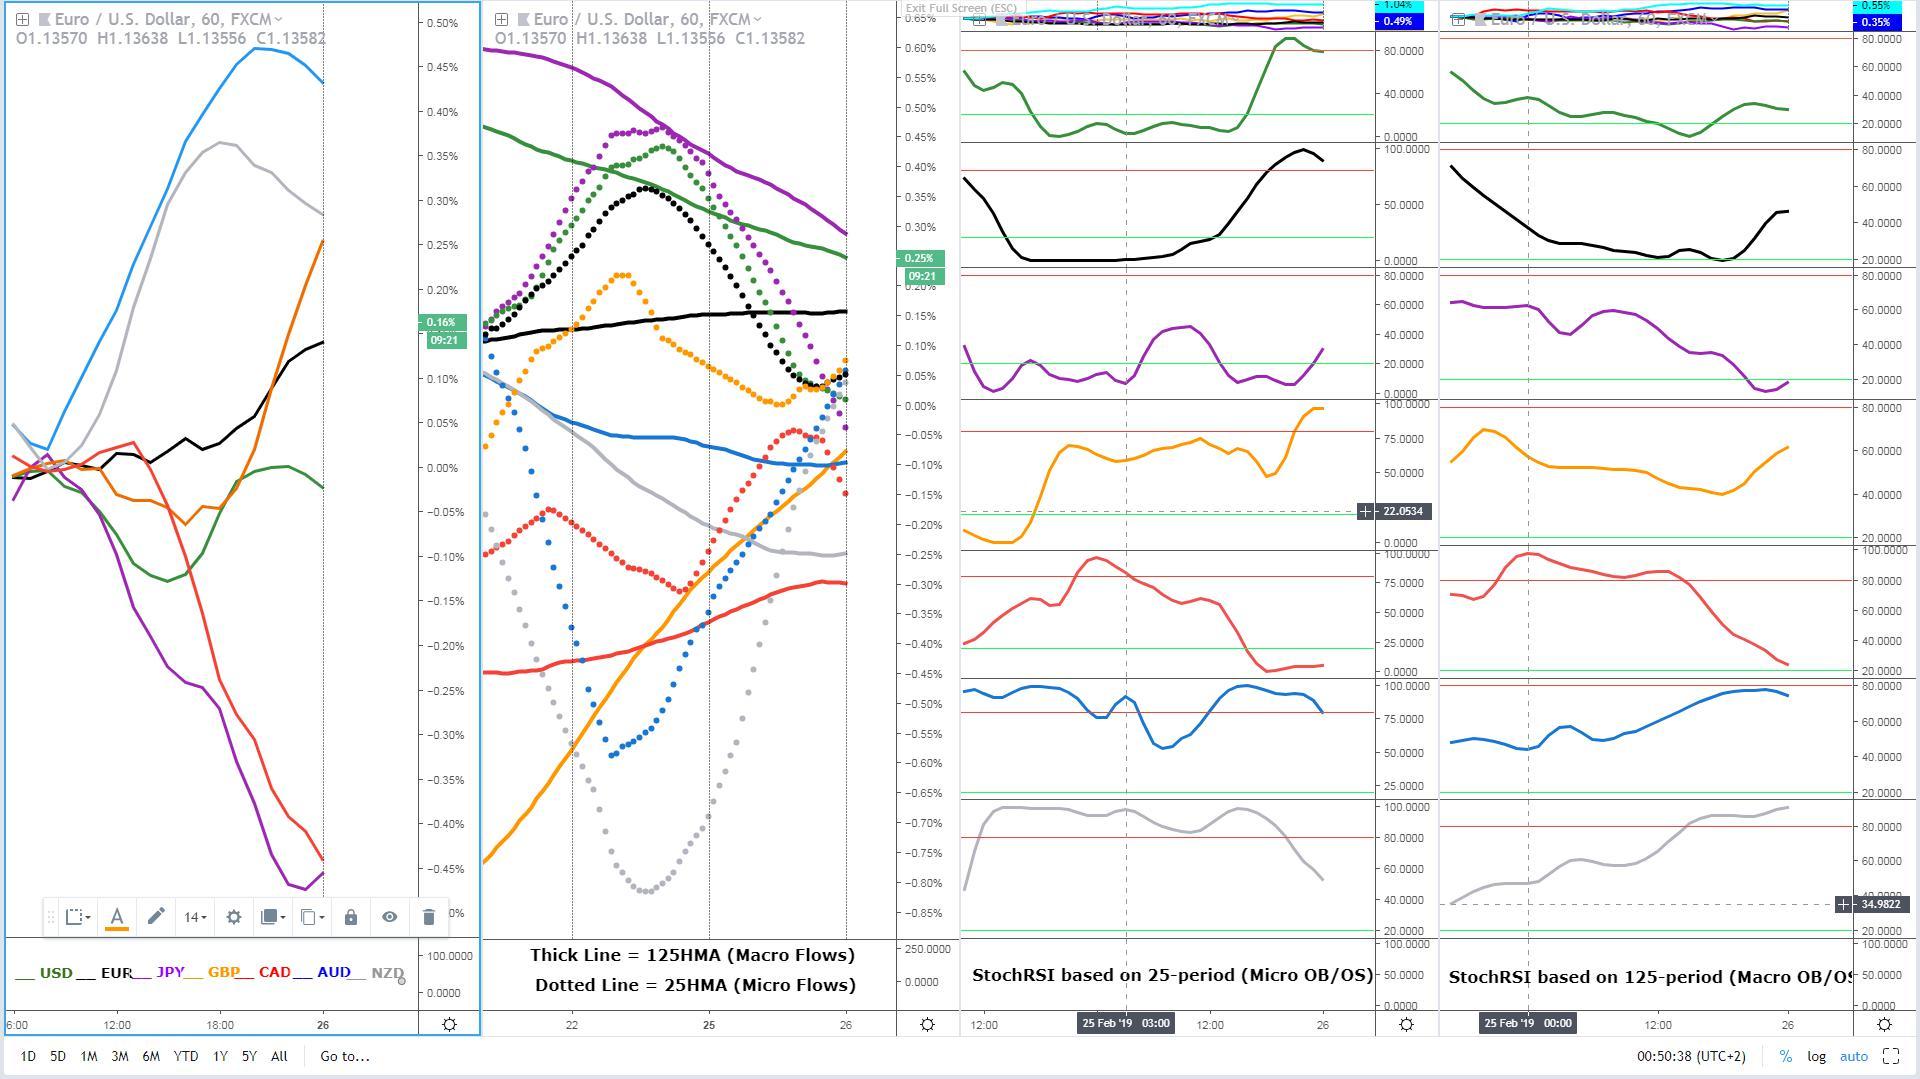
As the currency strength table above shows, the pound ended the NY session as the strongest of the pack, with the euro playing catch up yet lagging considerable behind. The Aussie and the Kiwi did well due to their beta profile at a time of risk-seeking strategies with ‘true risk on’ dominant. The DXY traded fairly neutral, with the Canadian dollar taking up the slack amid the collapse in Oil. In an environment where optimism is prevalent, the yen was understandably the other laggard.
In terms of macro flows (5DMA slopes), we can make the distinction of 3 different camps. The yen and the US dollar are the clear losers, especially the former. Then we have relatively neutral macro flows as per the flat slope of the 5DMA in the Aussie, euro, the Kiwi, and the Canadian dollar. The one market that registers an outlier’s profile is the pound, as the slope of the second chart reflects.
Narratives in Financial Markets
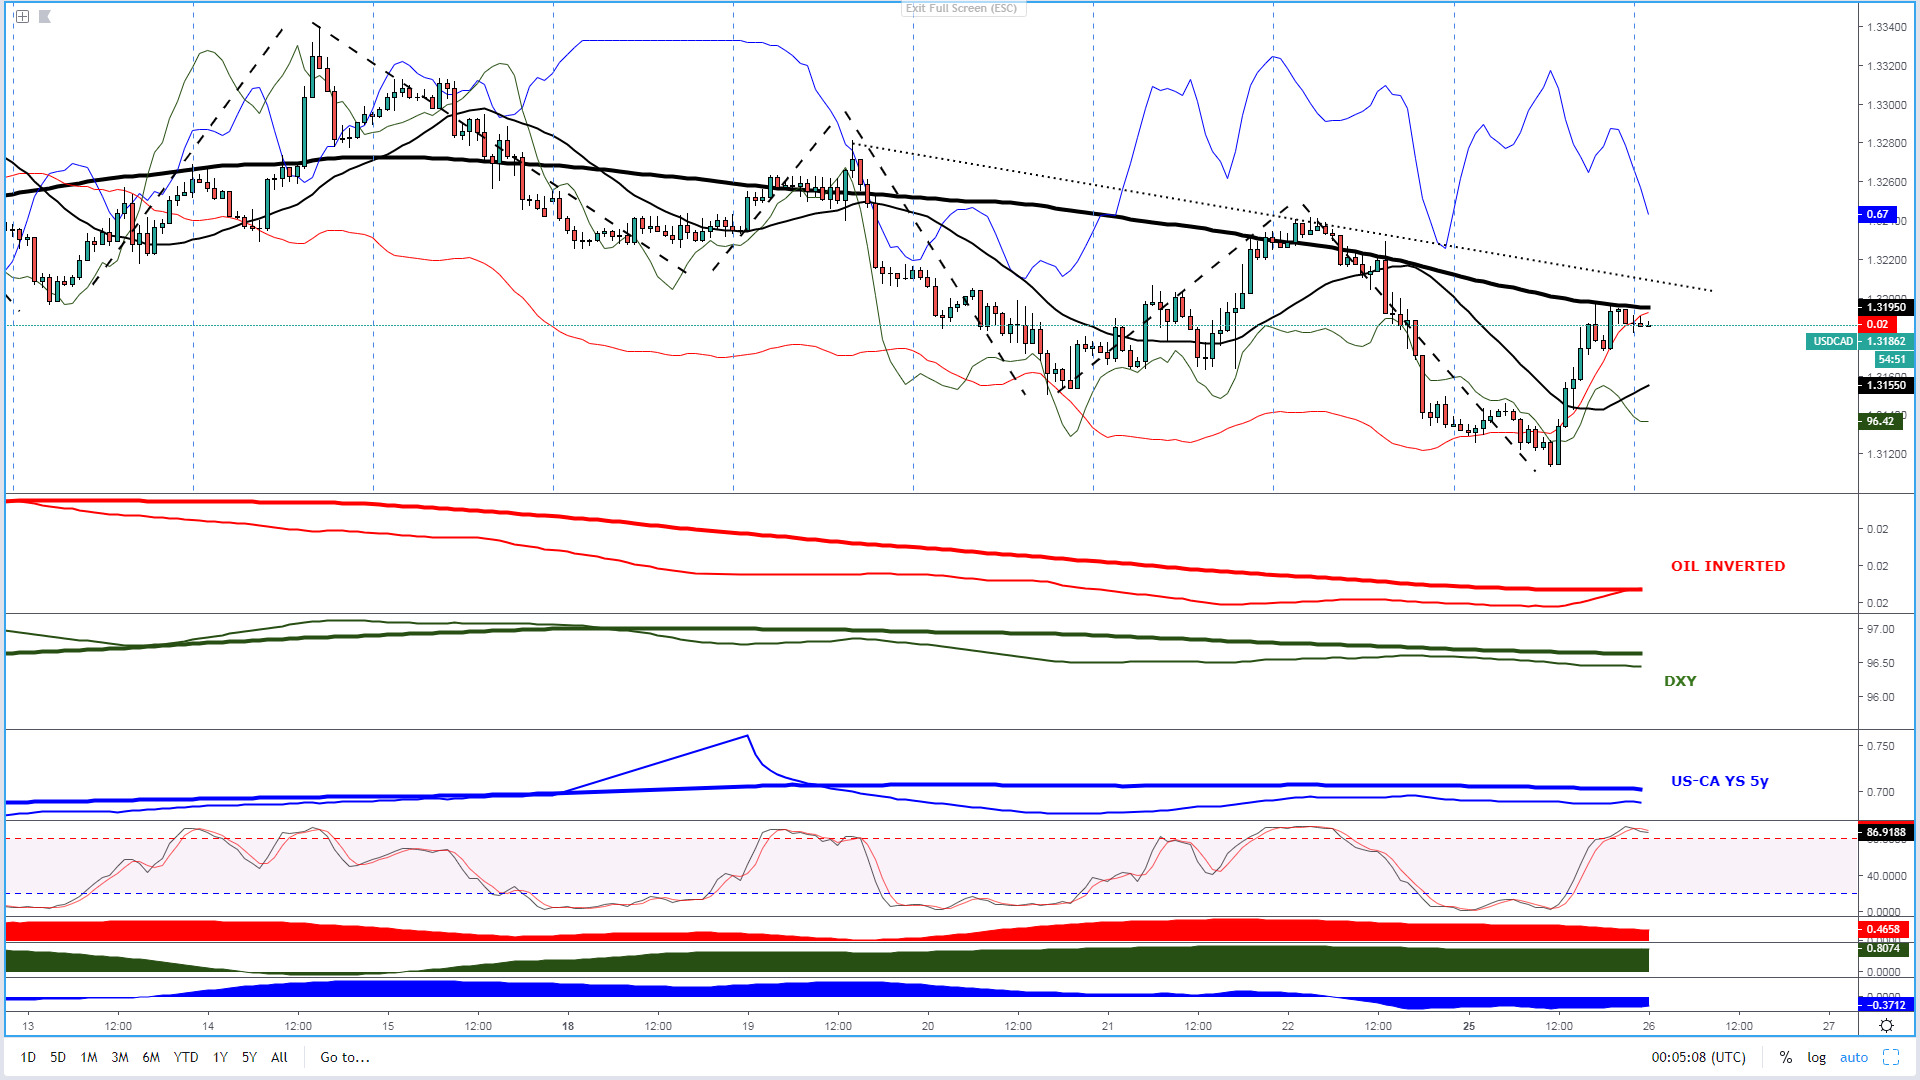
- The Loonie and the CAD traded heavily throughout the US session after US President Trump tweets that “Oil prices are getting too high”, aiming to put pressure on OPEC to take action.
- As the FX currency meter above shows, the Sterling was the outperformer after news broke out that UK Labour’s party supports a second referendum on Brexit, in what represents a major shift in stance. Adding to the positive mood in the GBP, Corbyn also said he is looking to back an amendment that supports avoiding a ‘no deal’ Brexit by any means possible.
- US President Trump, via Twitter, hinted about extending the March 1st deadline on China’s tariffs hike, with a summit with China’s President Xi being planned to conclude an agreement. At the same time, China’s diplomat Wang Yi said trade negotiations with the US have achieved ‘concrete progress’. Amid the optimism, Chinese equities were in a rampant mode up by more than 5% as the market anticipates a much-awaited deal in coming weeks.
- The dominant risk appetite theme continues to keep the JPY and the US Dollar on the backfoot with the positive rhetoric about the Sino-US grand trade deal at the epicenter. Other than GBP, the AUD and NZD as beta currencies are benefiting.
Economic Indicators/ Events Ahead
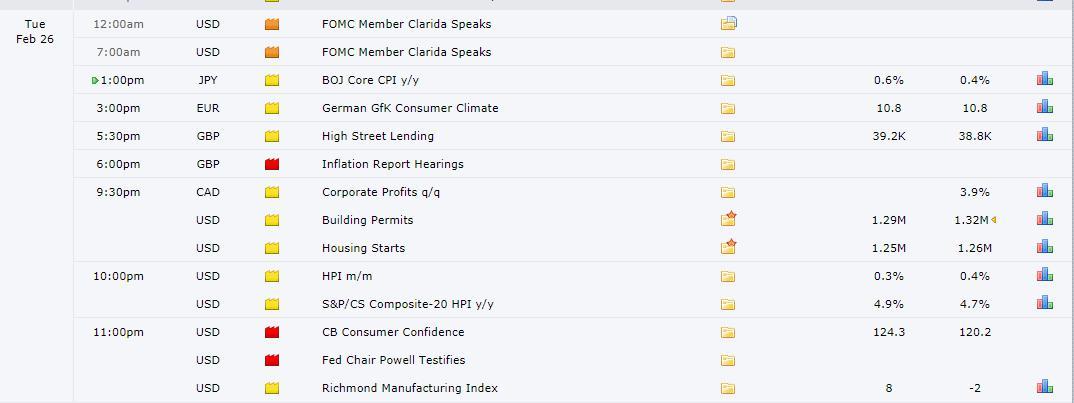
Source: ForexfactoryRORO - Risk On Risk Off Conditions
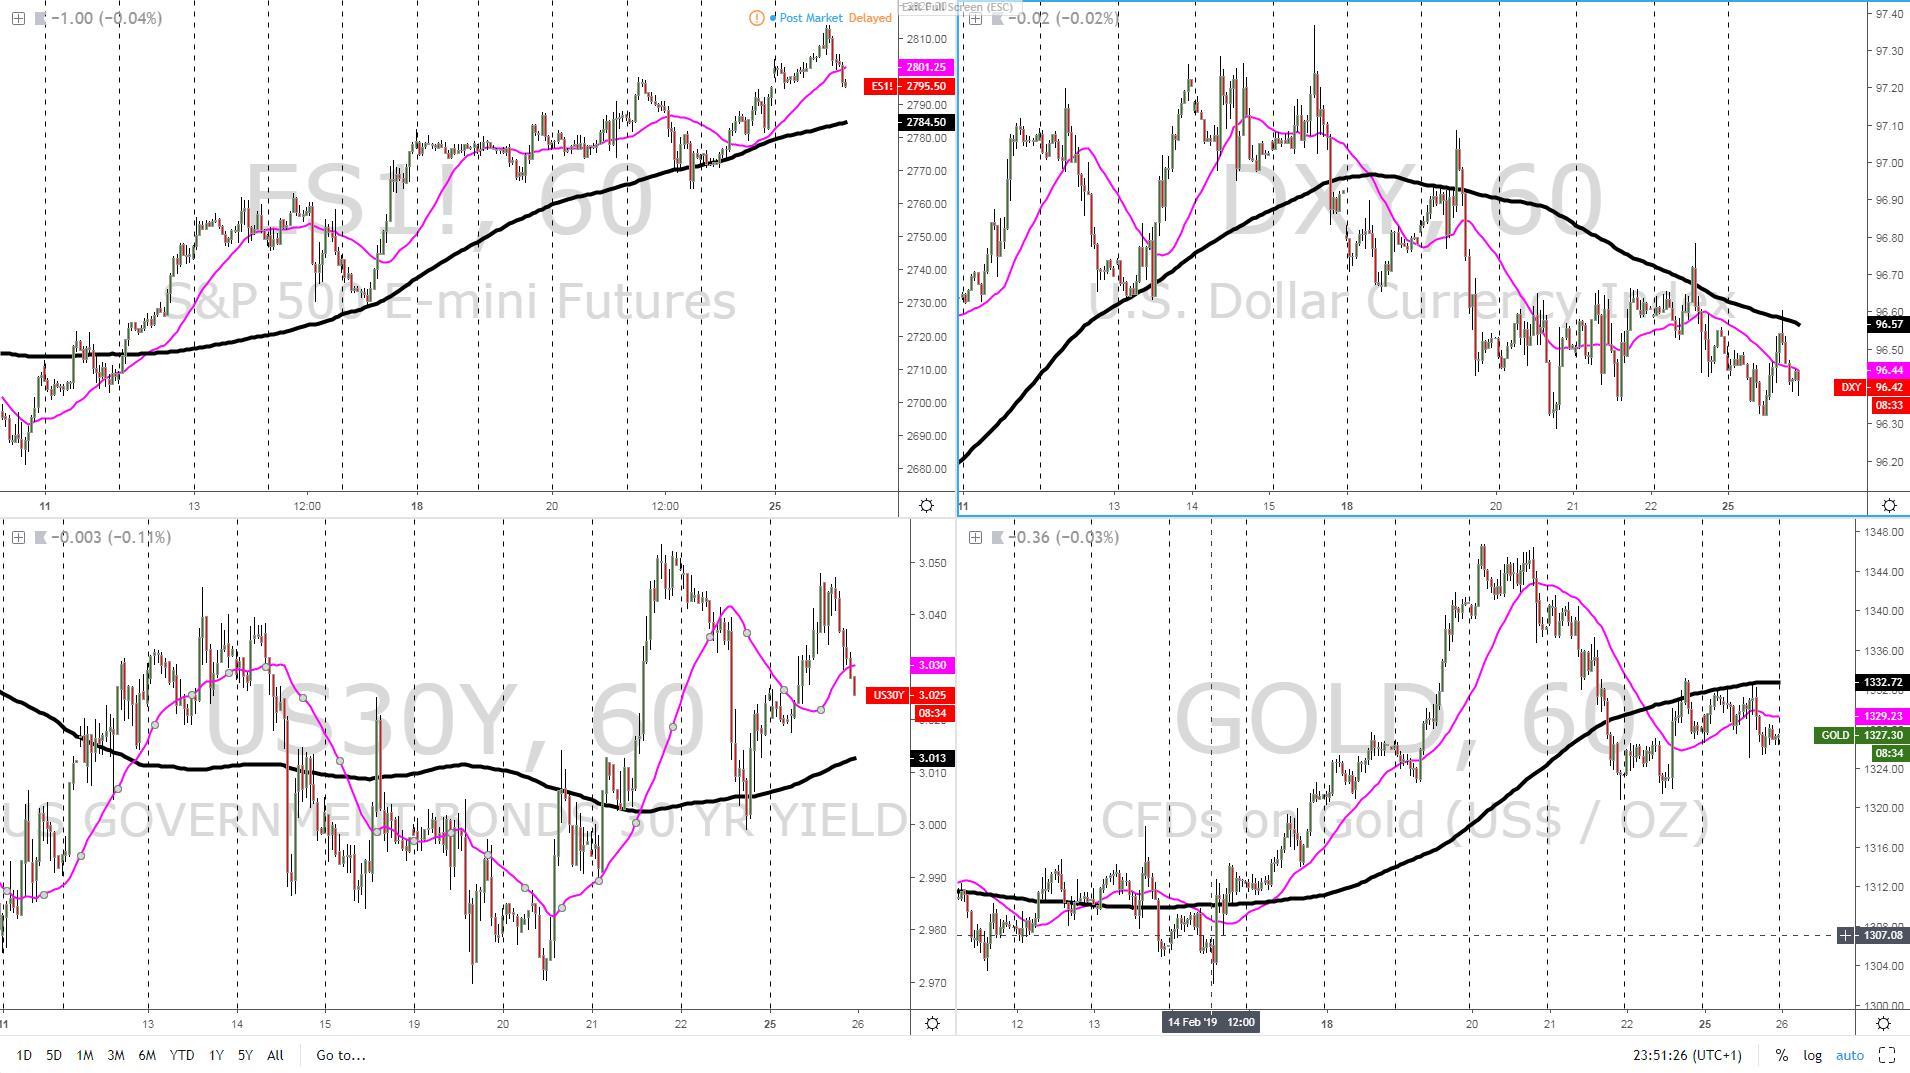
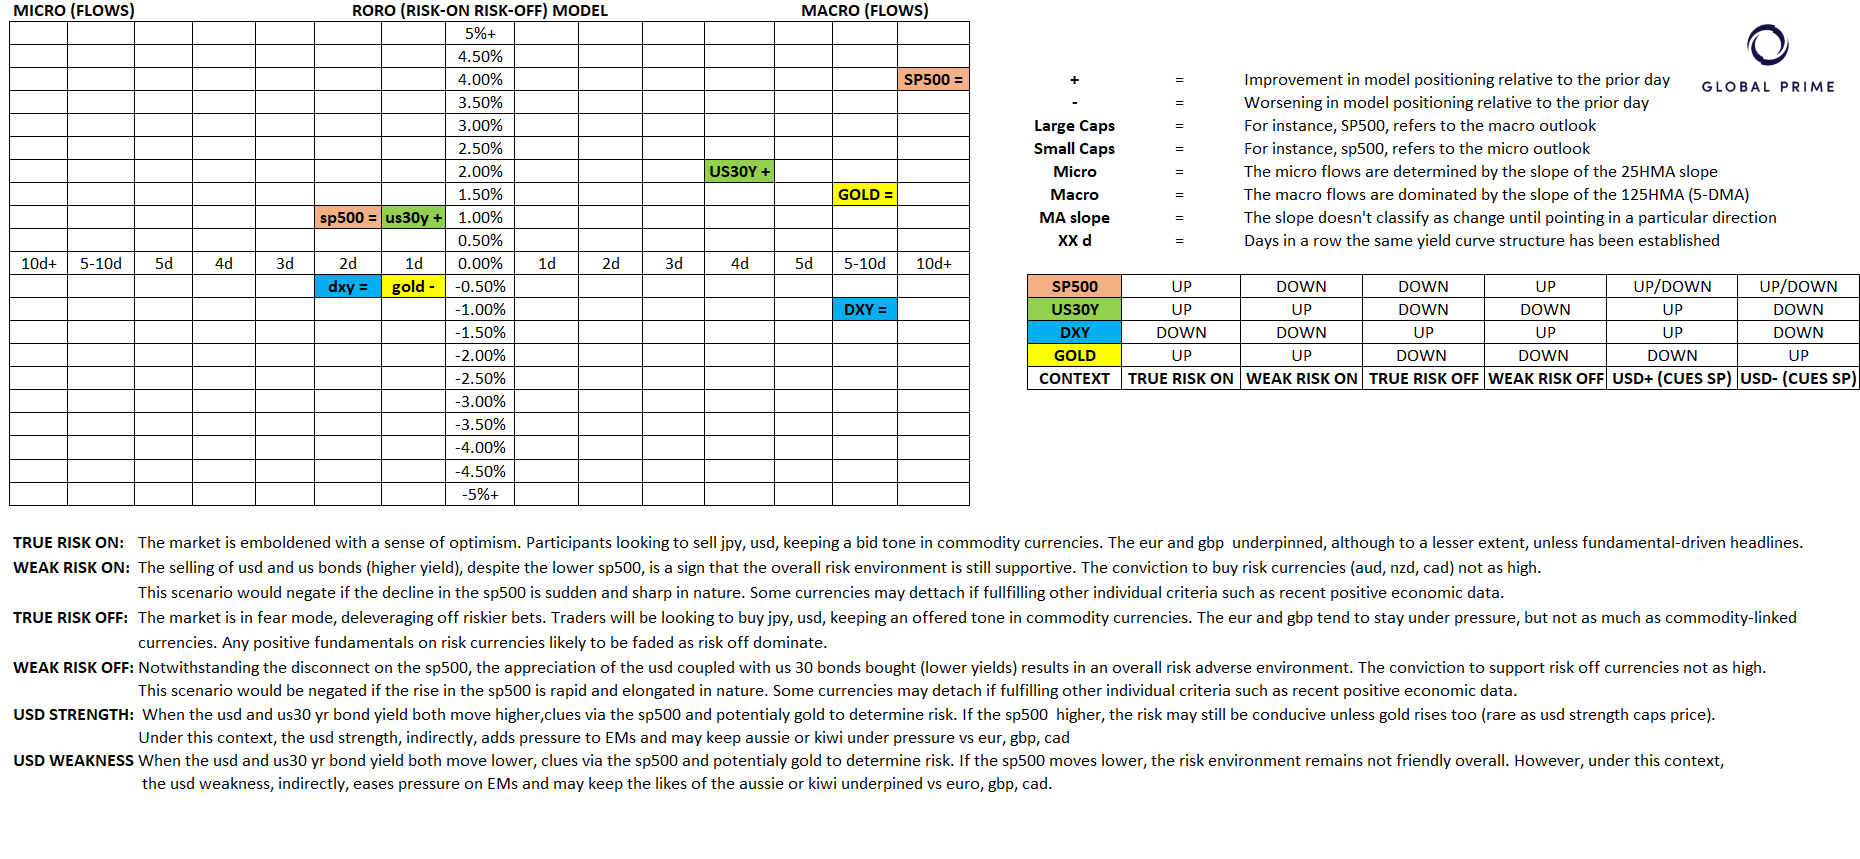
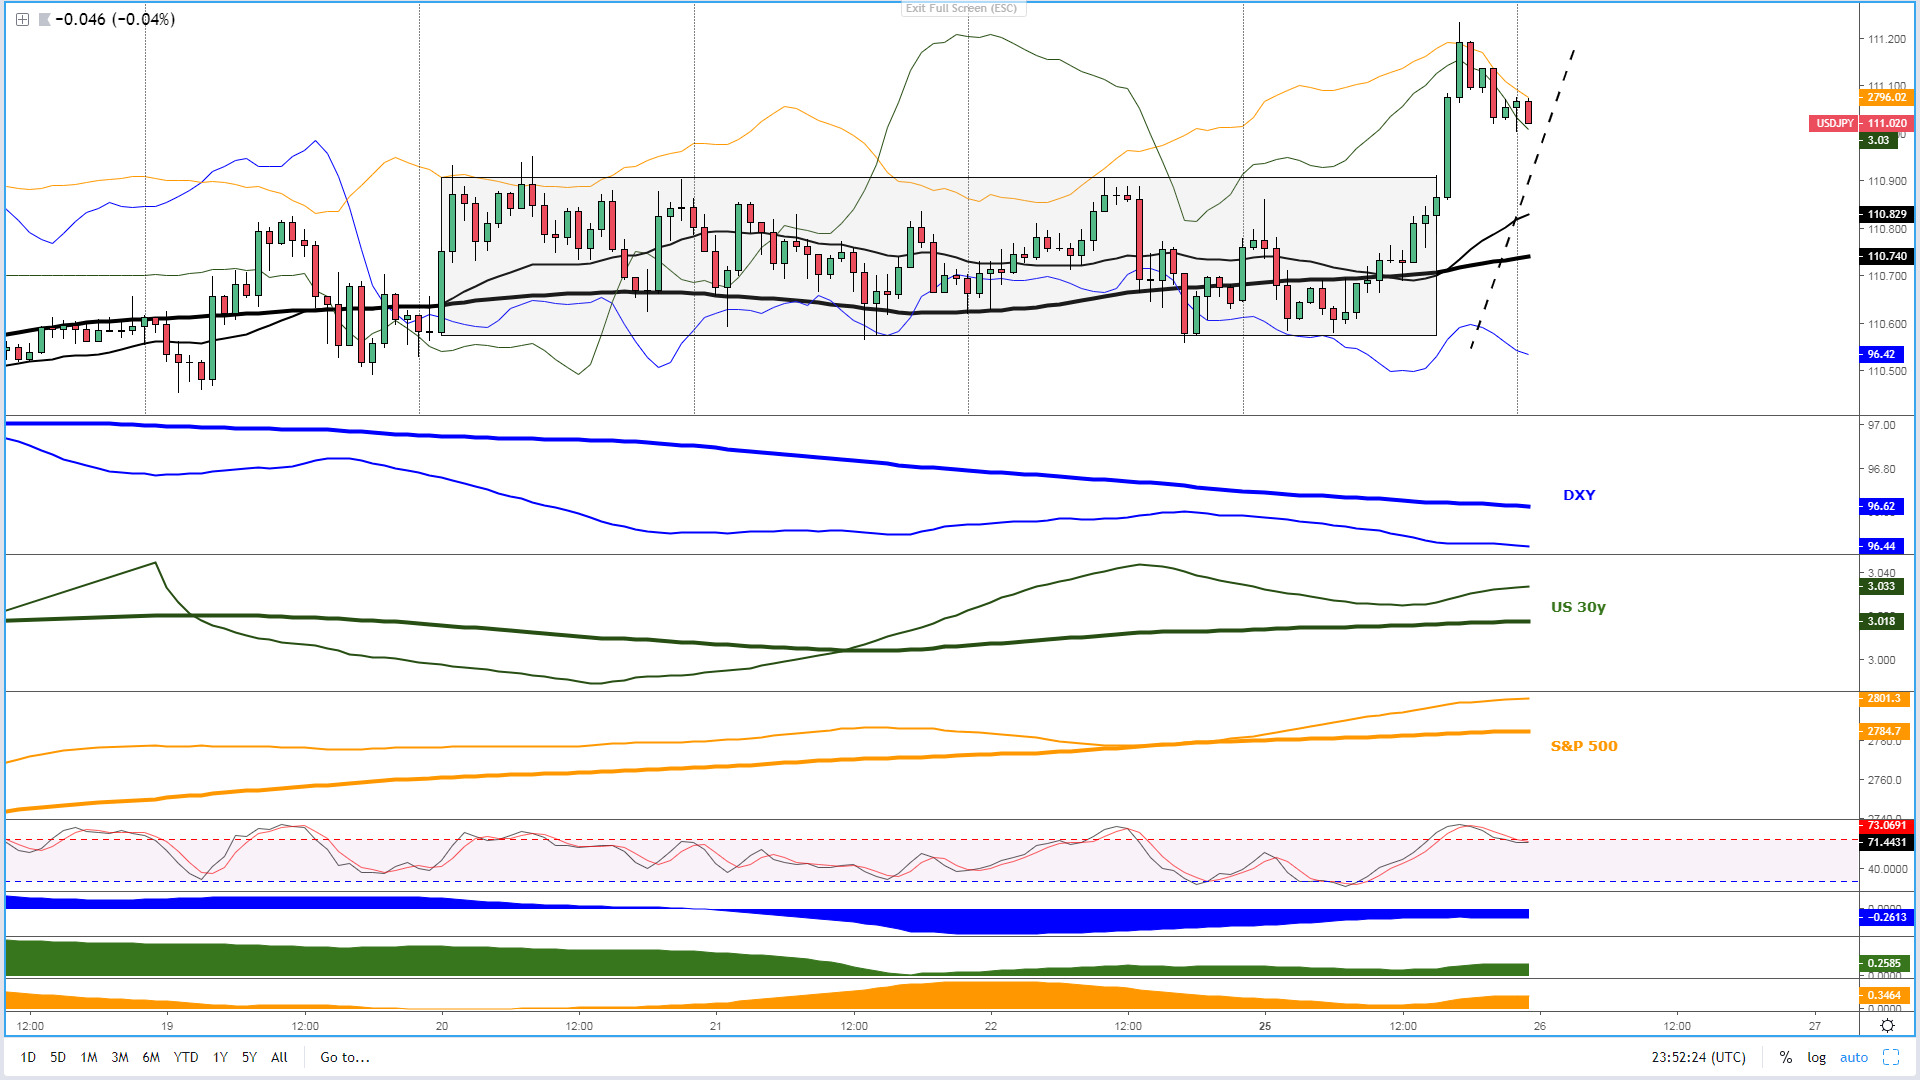
In the last 24h of price action, the notion that a US-China trade deal is getting closer has allowed us to transition into both the micro and macro paths to concur in what I classify as ‘true risk on’. The extension of a new up leg in the S&P 500, even if gains could not be sustained later on the day, has reverted the slope of the 25-HMA upwards, matching up the 5-DMA upward slope as well. Even long-dated US yield keep providing further support following further attempts to push back up towards 3.05% in the 30-yr.
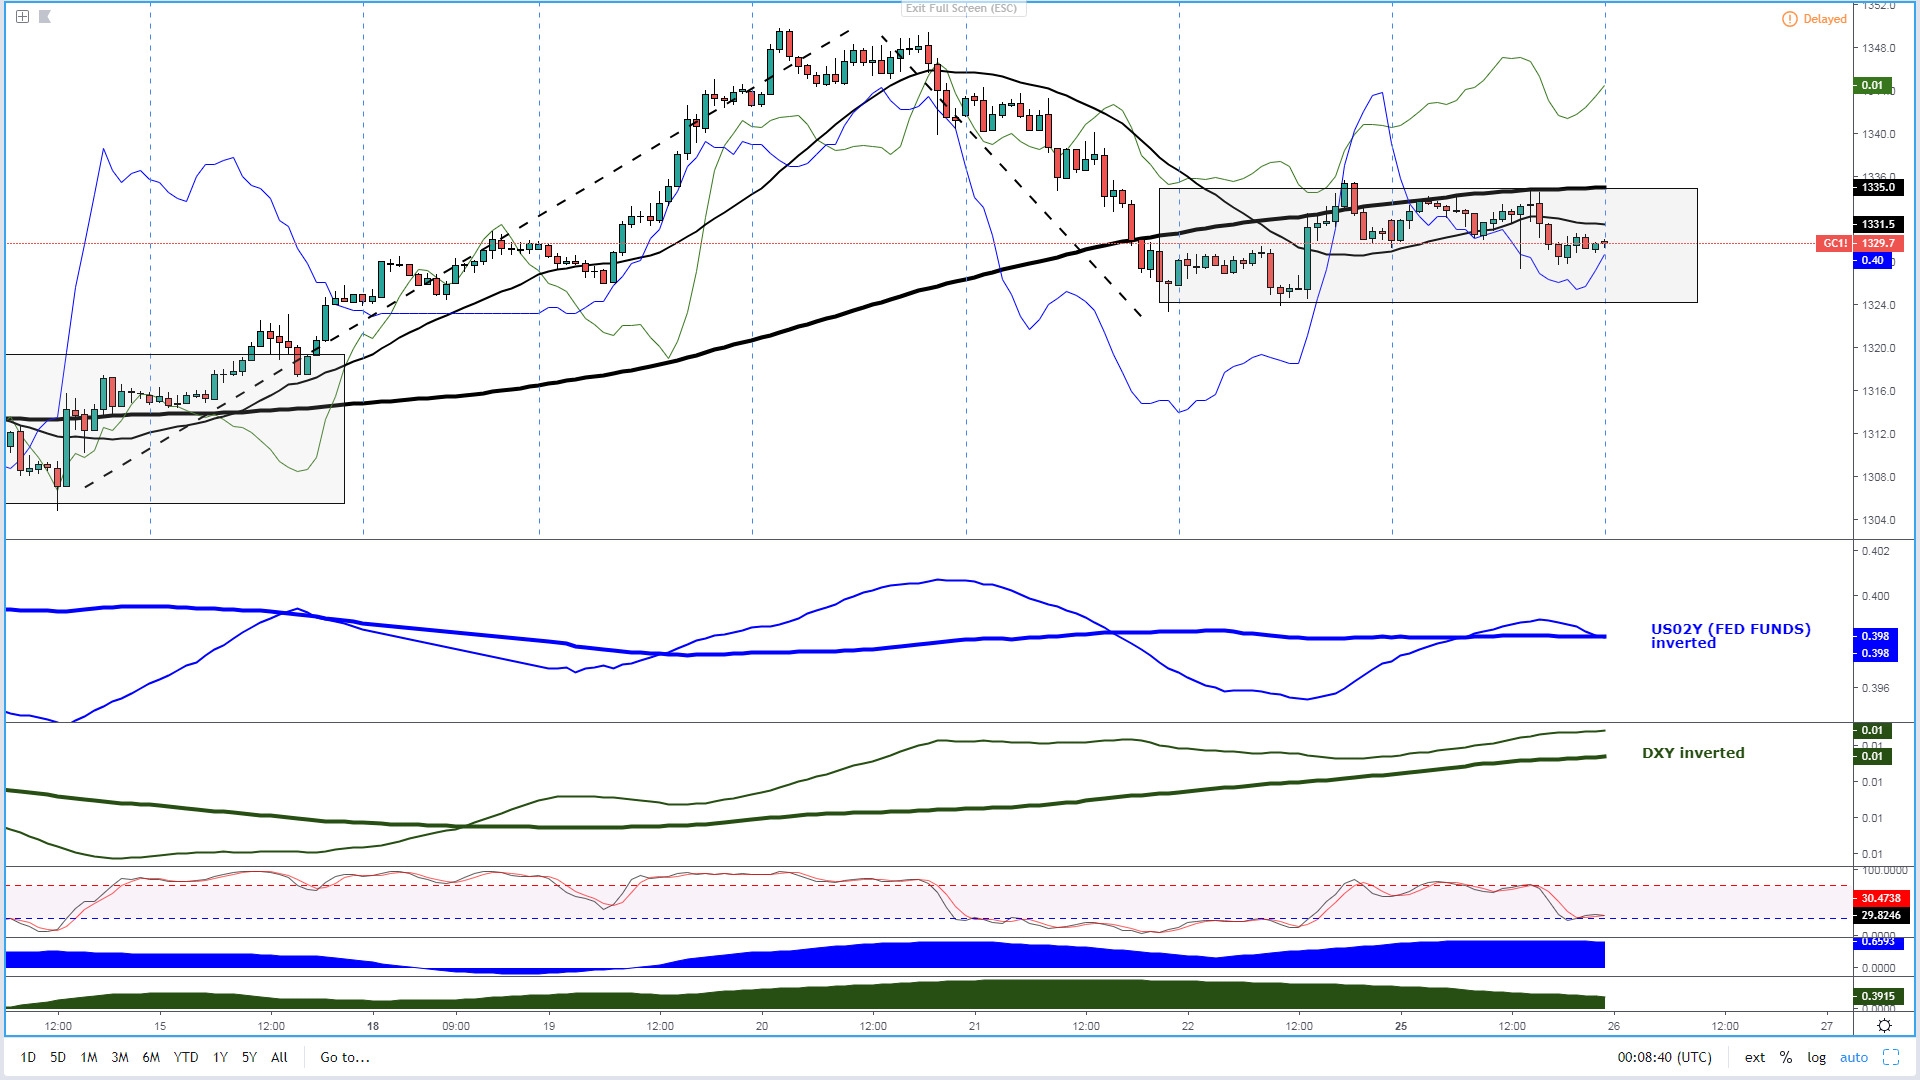
By the close of NY on Monday, both micro and macro slopes are pointing up, which only reinforces the strength of the ‘risk on’ dynamics. With equities and yields both technically constructive, the flows into the USD remain limited as it indicates the downward slope in both the micro and macro moving average used as a reference. Even gold is struggling to make gains in such a ‘risk on’ environment despite the mild USD weakness, which only vindicate the current mood as one where capital is seeking out riskier assets to invest (equities, beta currencies, credit).
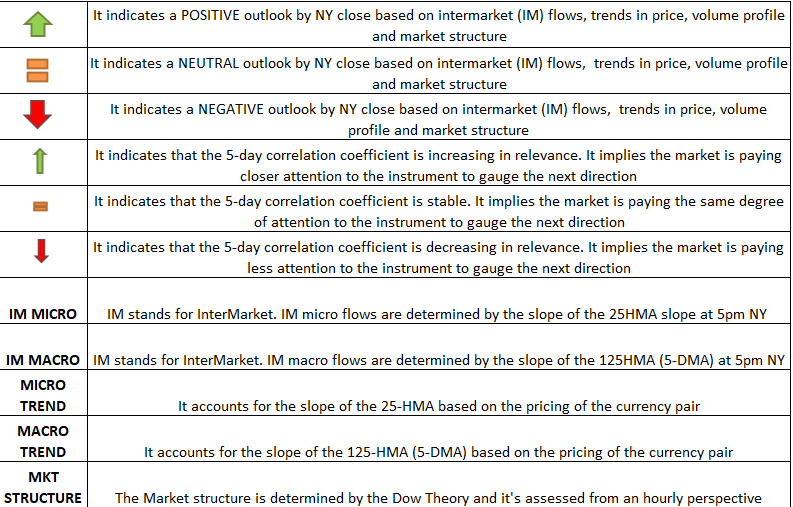
Dashboard: Intermarket Flows & Technical Analysis
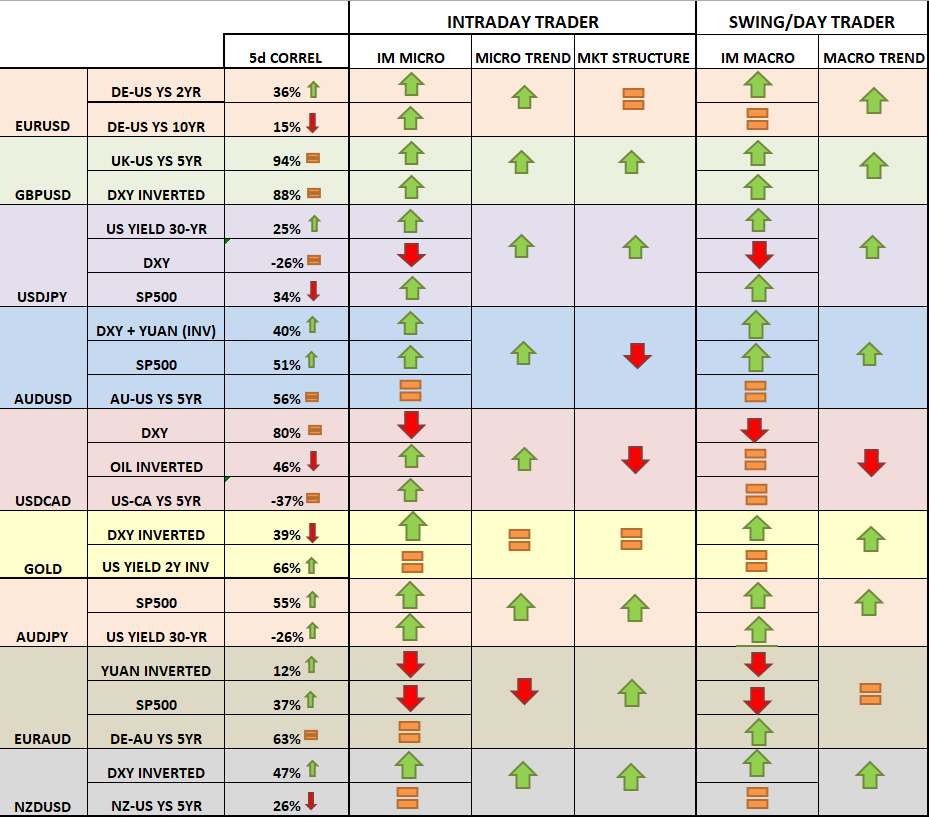
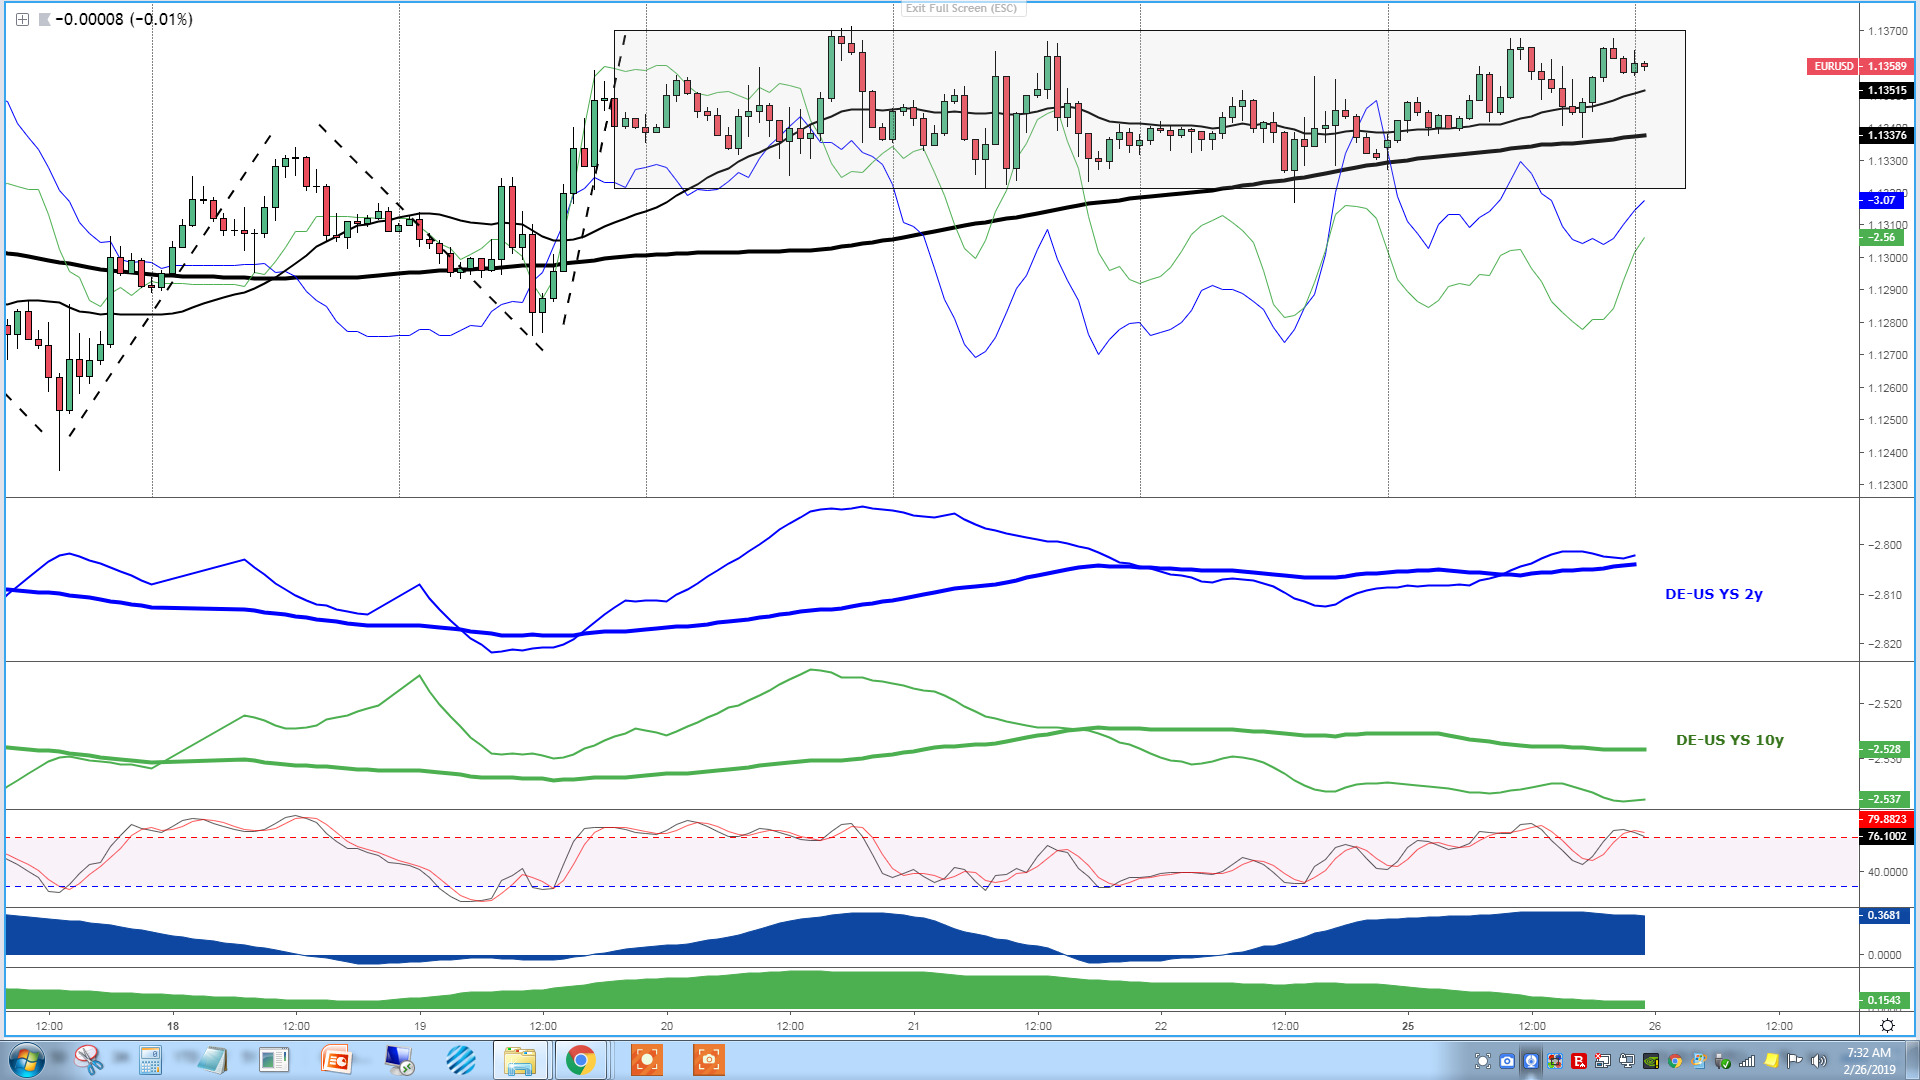
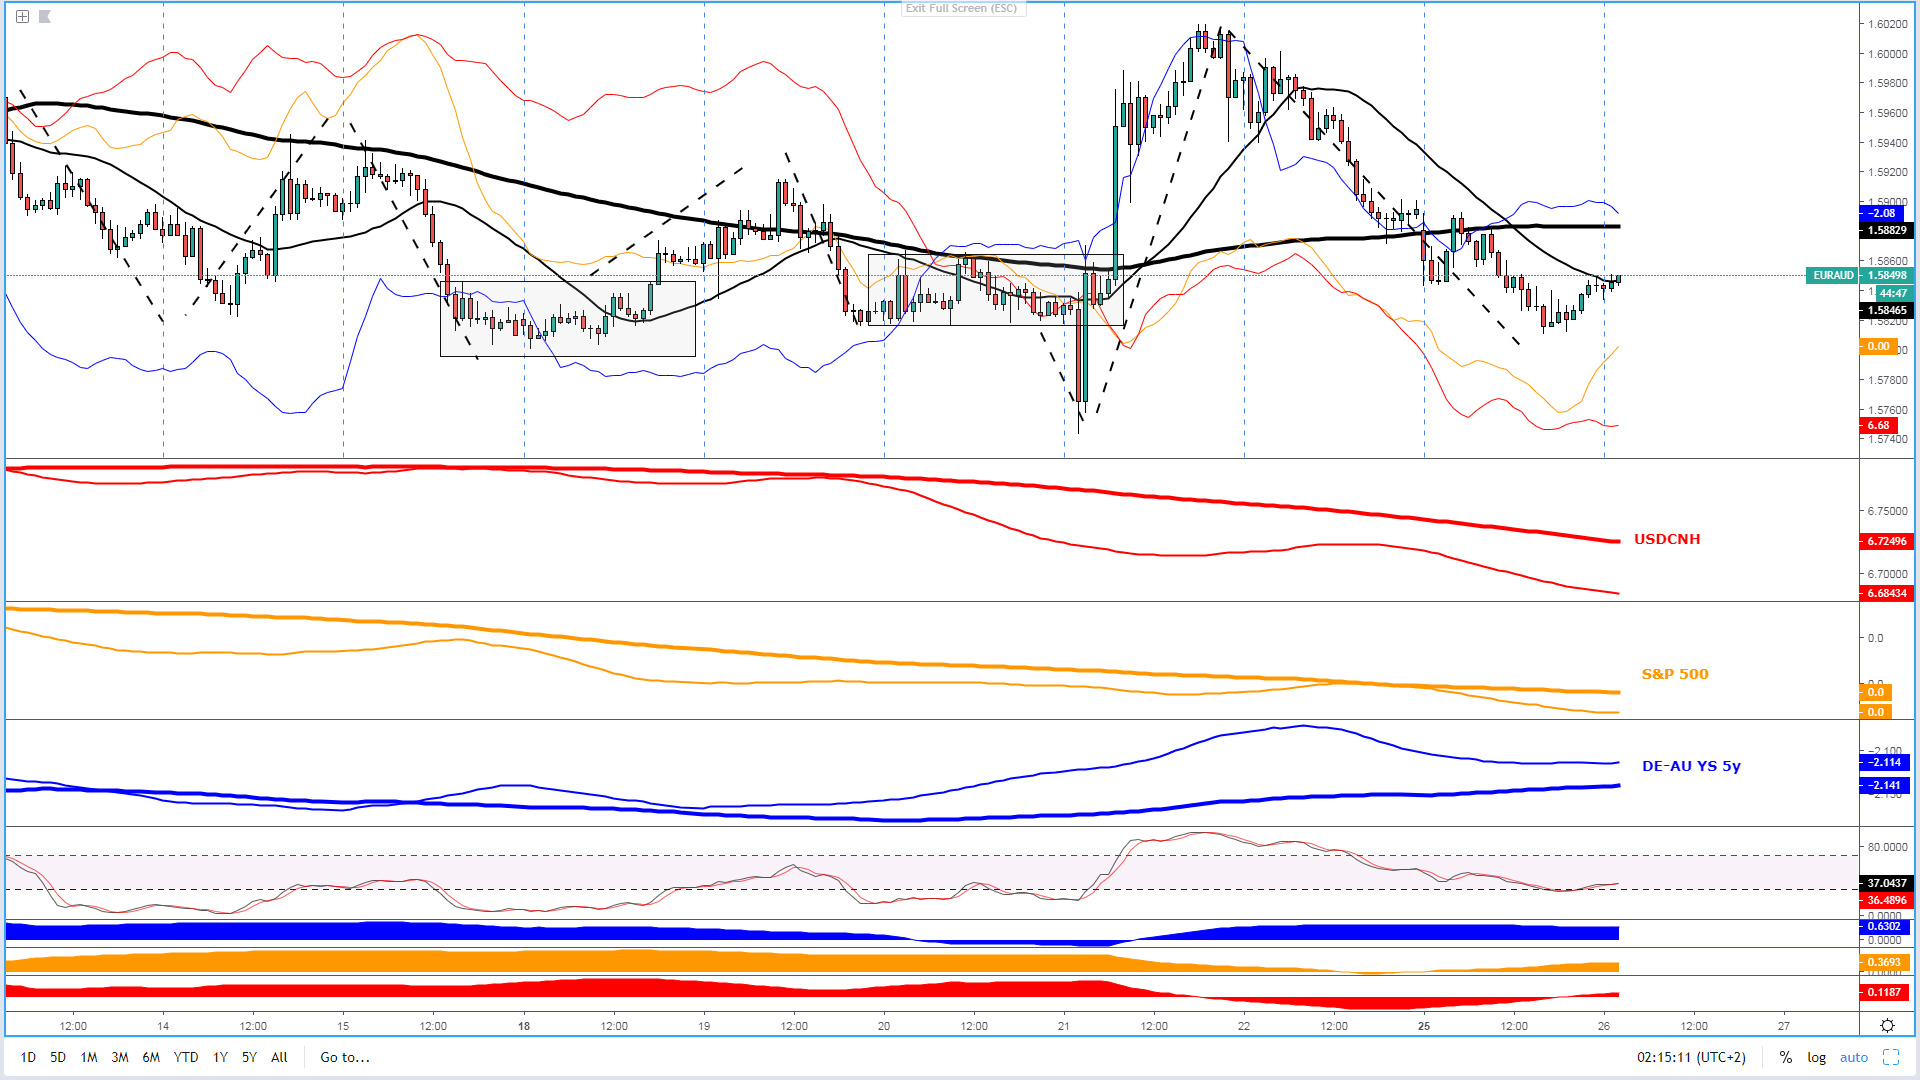
As today’s assignment of arrows (dynamics) suggest, the EUR may be setting up for an eventual breakout of its narrow range. At least, most of the measurements monitored to assess its strength seem to suggest that the upward pressure may continue based on the short-term yield differentials. Should a breakout eventuate, a notable directional movement may be in store as periods of compression tend to lead to brief spells of expansion in price discovery.
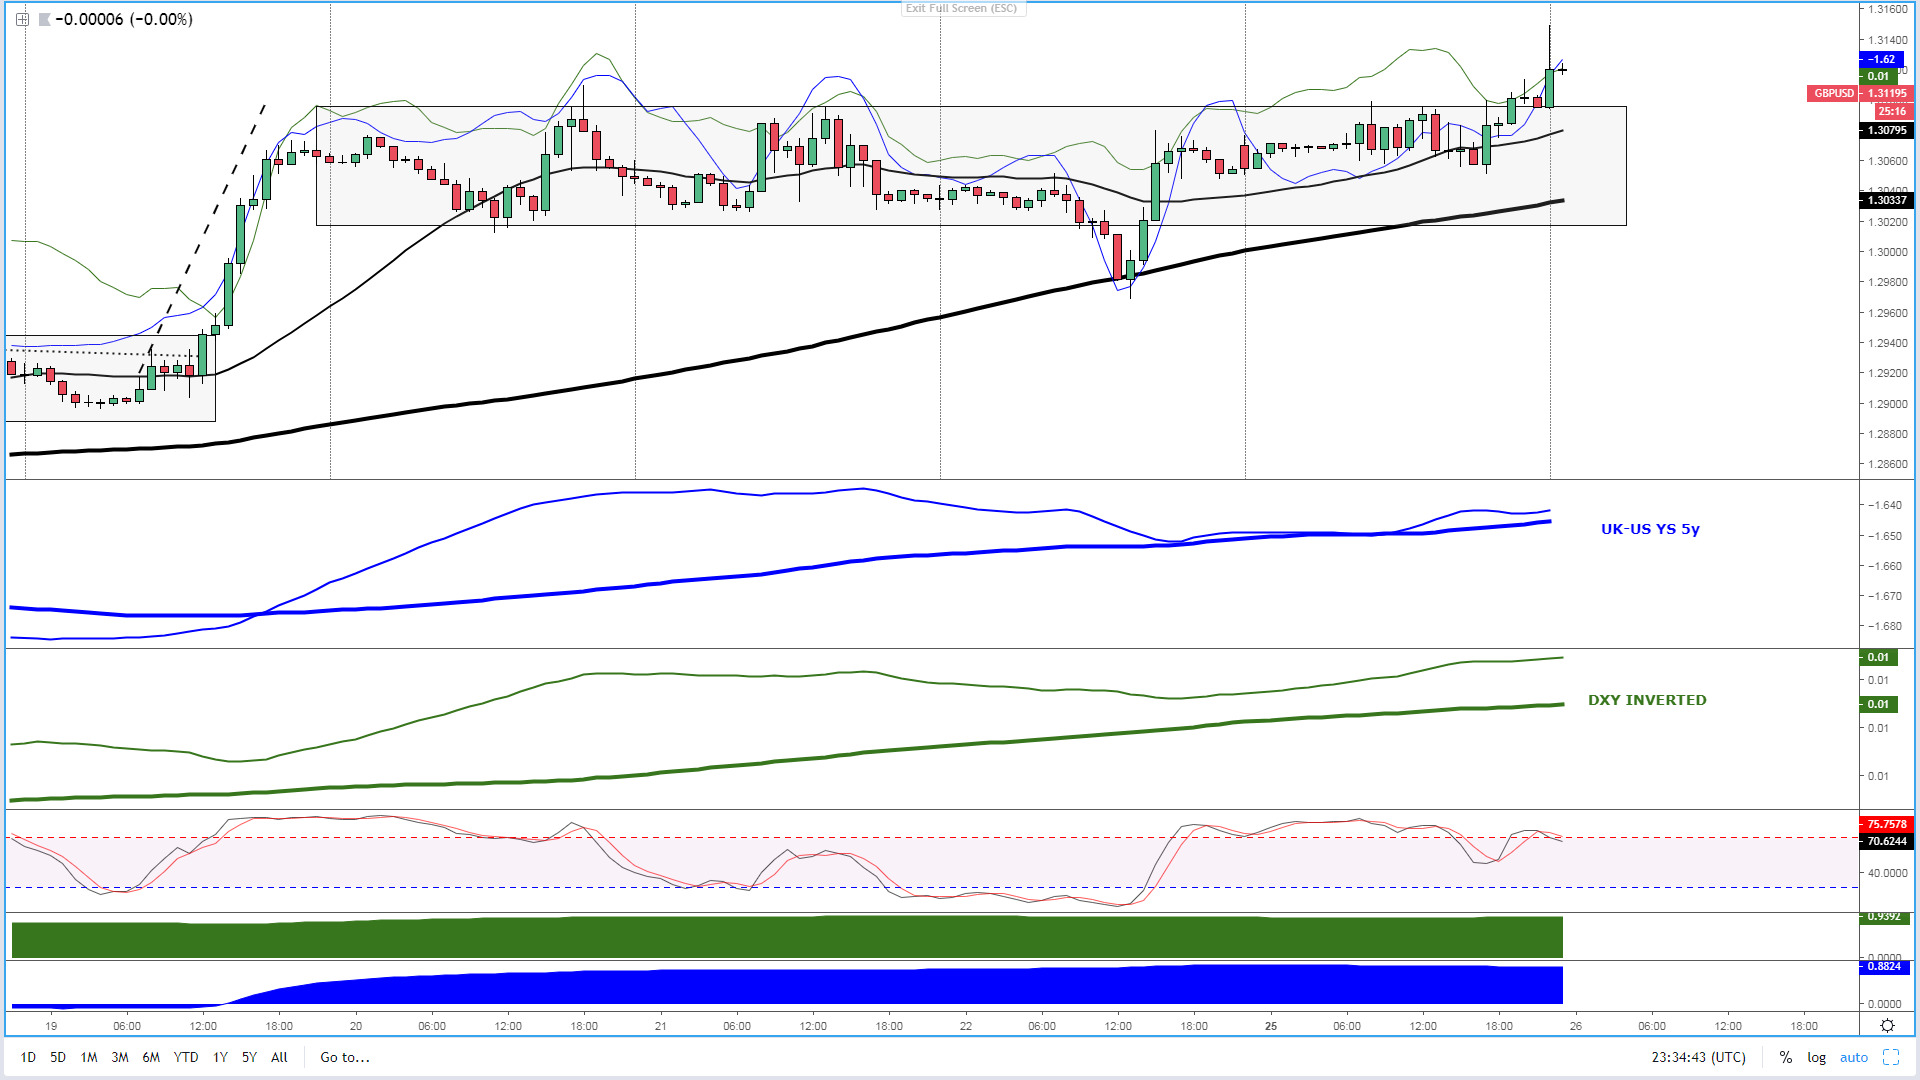
In terms of the Sterling, other than random negative Brexit headlines, it looks like the latest episode of buy-side action has exerted enough momentum to enhance the prospects that bulls will continue in control of this market for the next 24h of price action. It’s not often that we see across the board green arrows, with the conviction enhanced by the nearly 1:1 ratio in correlation measures vs the DXY and bond yields.
GBP/USD remains a 'buy on dips' type of market.
At last, USD/JPY has broken to the upside in a strong bullish fashion. I must say, the extension lacks the backing of the DXY strength, that’s why the overstretched nature of the intraday rally runs the risk of correcting towards the top of the broken range. As long as the ‘true risk on’ environment remains in place, this market looks poised to trade higher, although if one aims to capitalize on JPY supply inflows, other currency pairs such as the GBP/JPY, AUD/JPY or NZD/JPY look better positioned in light of the current state to seek out riskier currency bets.
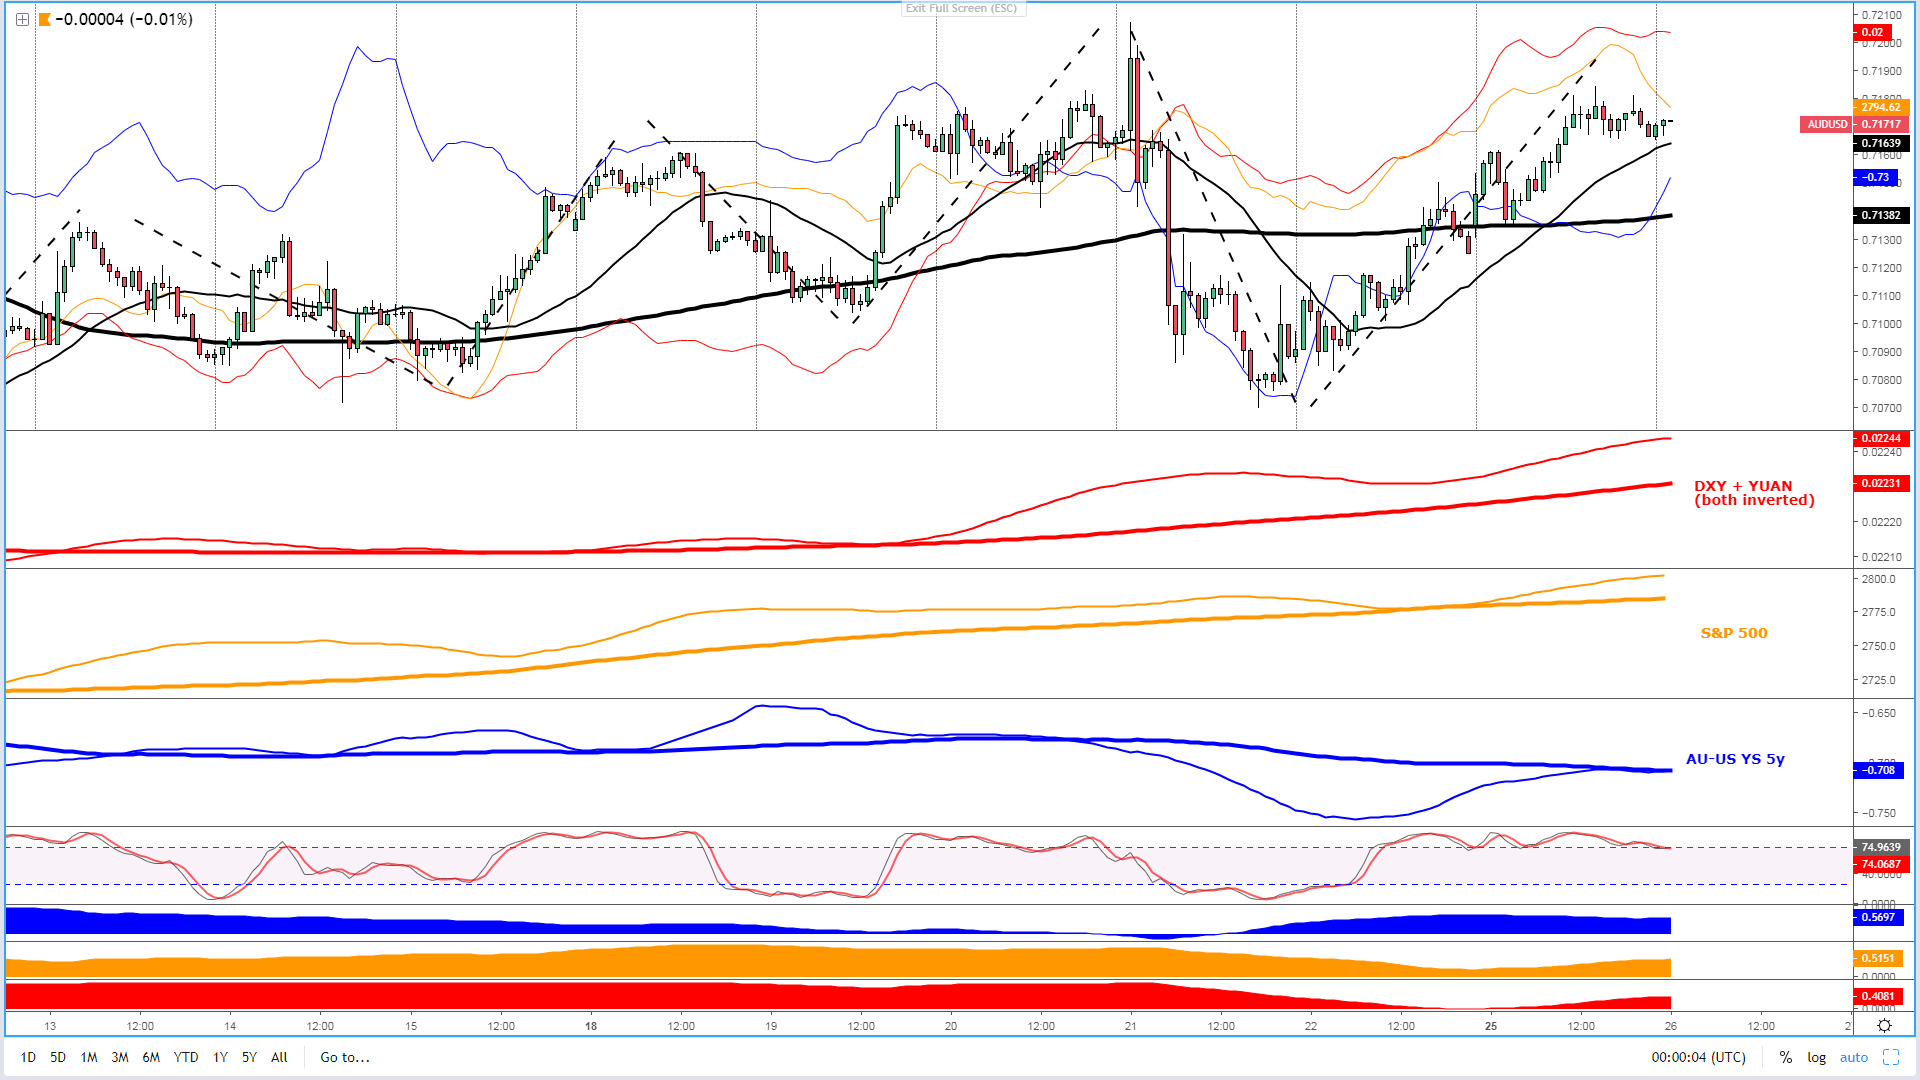
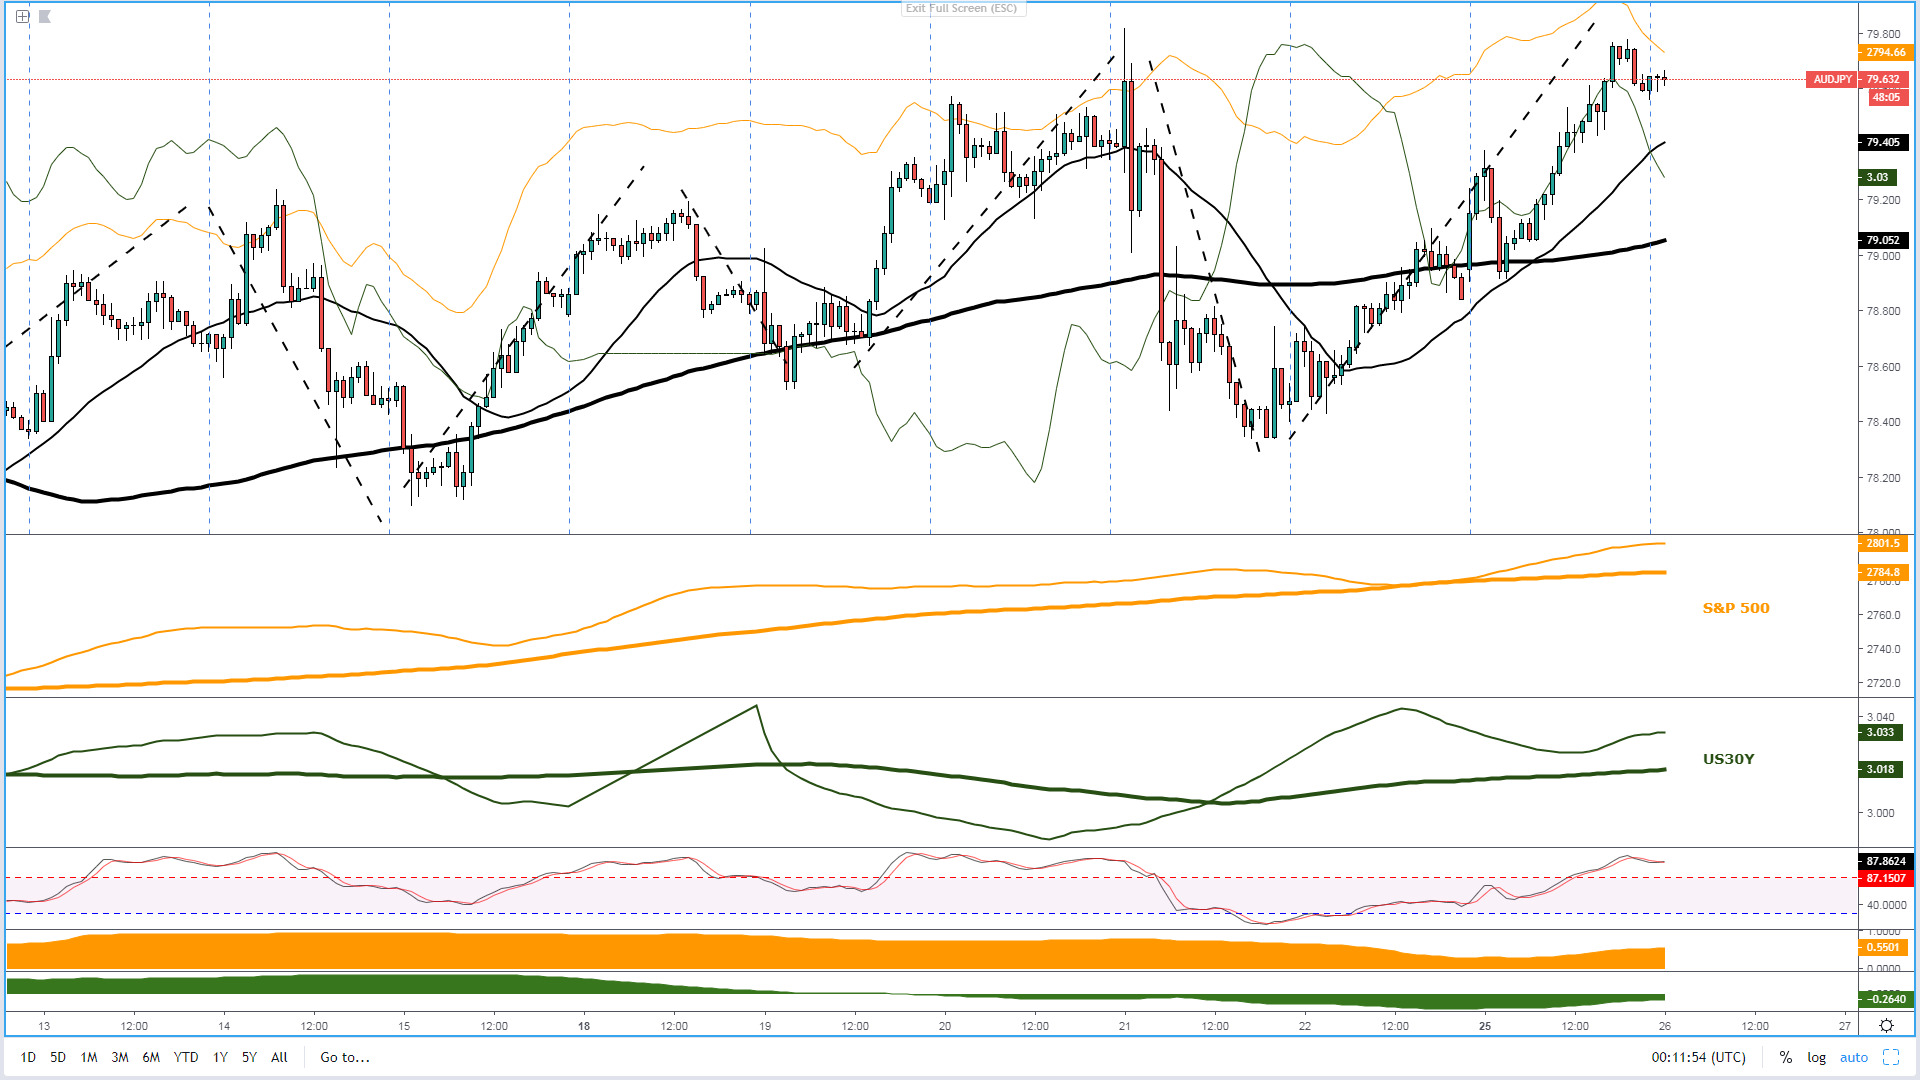
The Aussie continues to enjoy the support of its correlated instruments, even the AU-US bond yield spread is starting to pick up renewed momentum during Tuesday’s Asian session. Based on where we stand in terms of micro/macro flows (technicals and intermarket studies) by the end of business in NY at 5pm, the path of least resistance remains to the upside.
The USD/CAD has found strong buying interest, led by a sharp move down in Oil prices. Monday’s correction is far from a clear cut ‘sell on strength’ as long as Oil remains pressured. While the divergence against DXY prevails, there is not enough credence to just simply engage in selling this market in line with the dominant downtrend unless Oil and DXY start moving back down in locksteps.
Gold has entered a balance period, characterized by the cluster of bids/offers capping price fluctuations within 1,324.00 - 1,335.00 approximately. The consolidation occurs within a bullish market context coupled with still underpinning intermarket elements, mainly DXY weakness.
It all points towards further strength in the AUD/JPY. The constant imbalance of demand towards the Aussie is a reflection of the ebullient mood in financial markets. The pair should continue to embody the positive vibes around the US-China trade negotiations with further upside. Any spontaneous setbacks due to the reversal of microflows should be considered potential opportunities to buy the pair at more attractive wholesale prices. The outlook table above is a sea of green for now.
If you are looking to engage in buy-side action in the EUR/AUD, be aware that the major element in your favor might be the market structure in the hourly, which still offers bullish credence. However, the strength in the yuan and equities makes any run likely limited in nature. Should the pair enter overbought conditions, with the macro slopes in correlated assets heading south, this could be a very interesting market to play shorts. On the contrary, if the microflows start to revert to the upside, there might also be opportunities near-term to go long in line with the market structure.
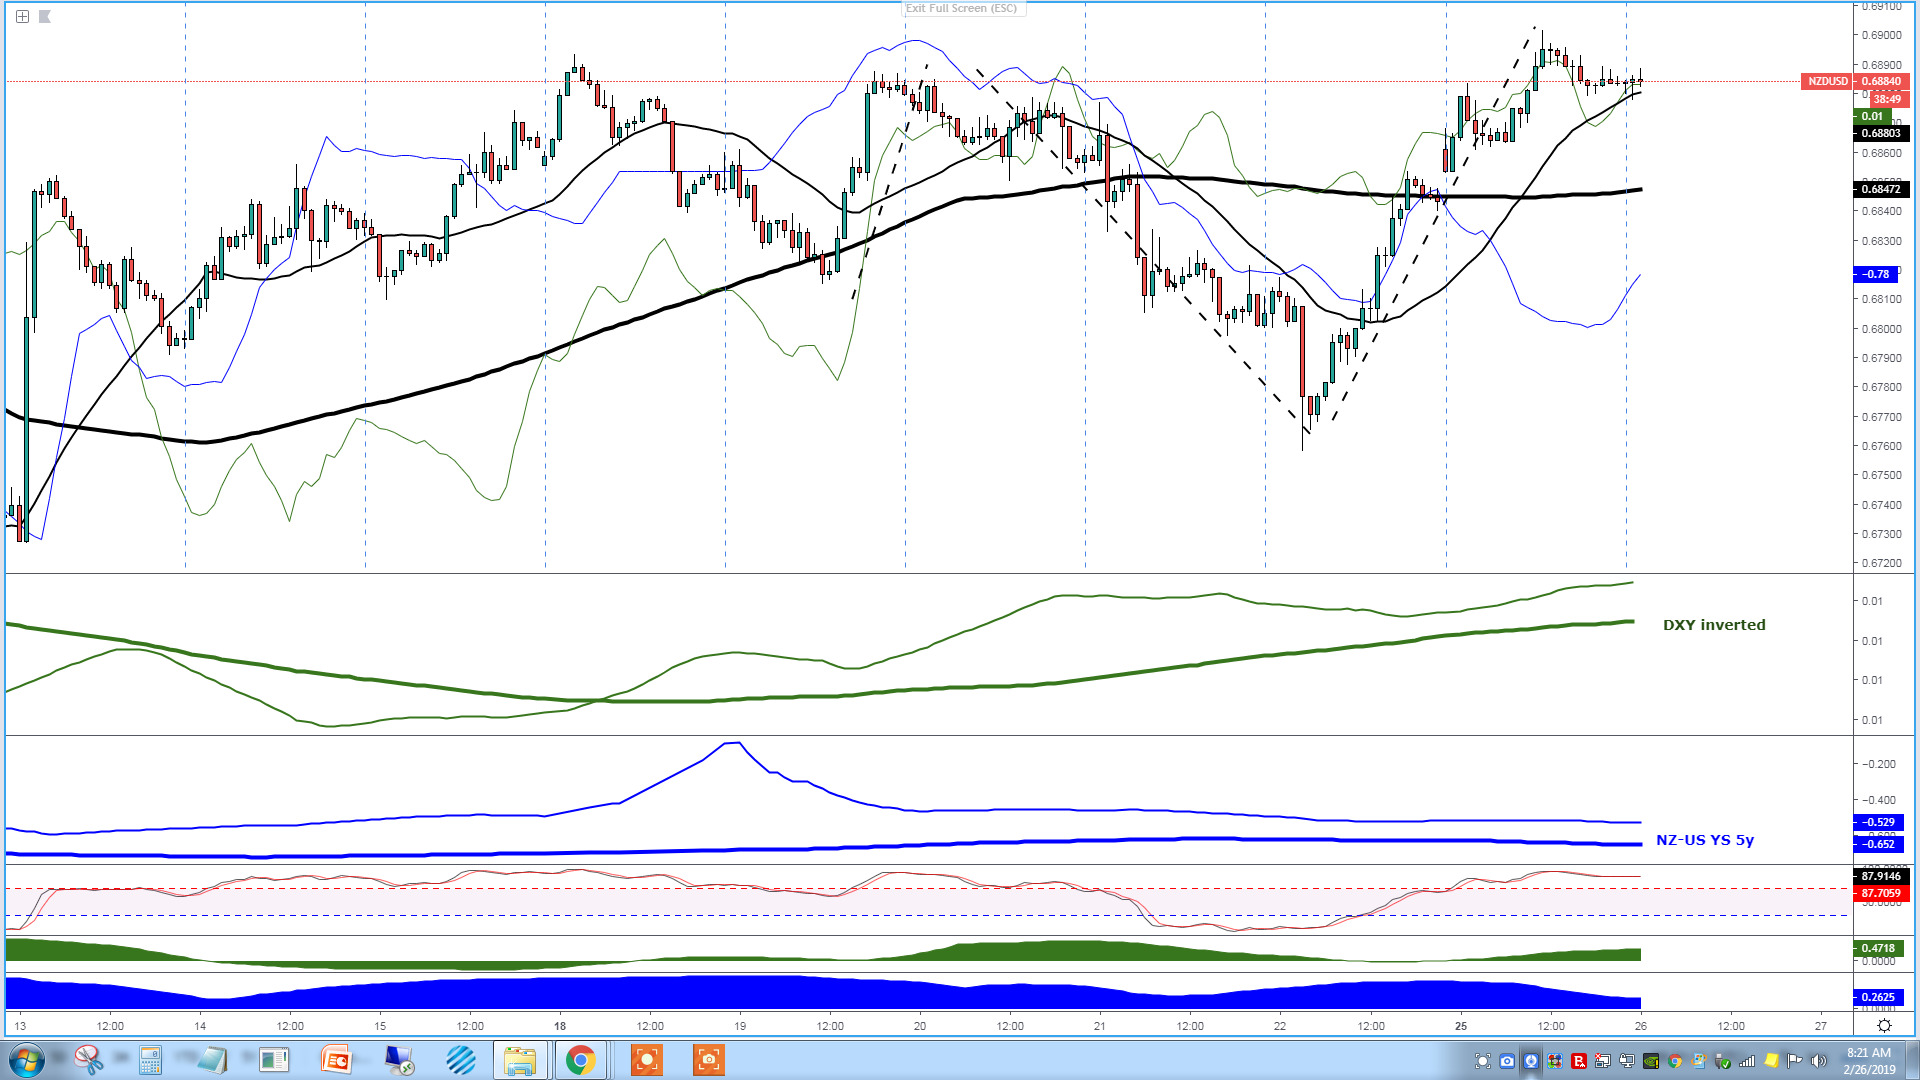
With regards to the Kiwi, notice that it has followed the NZ-US yield spread differential with a great degree of accuracy as of late. This leads me to think that the overextension in the last 2 days may be running out of juice should the microflows turn negative, which is not yet the case. Nonetheless, it’s also notable that there is a macro divergence with the yield spread, which should reinforce the notion of selling overstretched movements. But only under one important condition, that is, if the ‘true risk on’ environment transitions into weak ‘risk off’ by DXY strength or lower equities/yields.
Important Footnotes
- Risk model: The fact that financial markets have become so intertwined and dynamic makes it essential to stay constantly in tune with market conditions and adapt to new environments. This prop model will assist you to gauge the context that you are trading so that you can significantly reduce the downside risks. To understand the principles applied in the assessment of this model, refer to the tutorial How to Unpack Risk Sentiment Profiles
- Cycles: Markets evolve in cycles followed by a period of distribution and/or accumulation. The weekly cycles are highlighted in red, blue refers to the daily, while the black lines represent the hourly cycles. To understand the principles applied in the assessment of cycles, refer to the tutorial How To Read Market Structures In Forex
- POC: It refers to the point of control. It represents the areas of most interest by trading volume and should act as walls of bids/offers that may result in price reversals. The volume profile analysis tracks trading activity over a specified time period at specified price levels. The study reveals the constant evolution of the market auction process. If you wish to find out more about the importance of the POC, refer to the tutorial How to Read Volume Profile Structures
- Tick Volume: Price updates activity provides great insights into the actual buy or sell-side commitment to be engaged into a specific directional movement. Studies validate that price updates (tick volume) are highly correlated to actual traded volume, with the correlation being very high, when looking at hourly data. If you wish to find out more about the importance tick volume, refer to the tutorial on Why Is Tick Volume Important To Monitor?
- Horizontal Support/Resistance: Unlike levels of dynamic support or resistance or more subjective measurements such as fibonacci retracements, pivot points, trendlines, or other forms of reactive areas, the horizontal lines of support and resistance are universal concepts used by the majority of market participants. It, therefore, makes the areas the most widely followed and relevant to monitor. The Ultimate Guide To Identify Areas Of High Interest In Any Market
- Trendlines: Besides the horizontal lines, trendlines are helpful as a visual representation of the trend. The trendlines are drawn respecting a series of rules that determine the validation of a new cycle being created. Therefore, these trendline drawn in the chart hinge to a certain interpretation of market structures.
- Correlations: Each forex pair has a series of highly correlated assets to assess valuations. This type of study is called inter-market analysis and it involves scoping out anomalies in the ever-evolving global interconnectivity between equities, bonds, currencies, and commodities. If you would like to understand more about this concept, refer to the tutorial How Divergence In Correlated Assets Can Help You Add An Edge.
- Fundamentals: It’s important to highlight that the daily market outlook provided in this report is subject to the impact of the fundamental news. Any unexpected news may cause the price to behave erratically in the short term.
- Projection Targets: The usefulness of the 100% projection resides in the symmetry and harmonic relationships of market cycles. By drawing a 100% projection, you can anticipate the area in the chart where some type of pause and potential reversals in price is likely to occur, due to 1. The side in control of the cycle takes profits 2. Counter-trend positions are added by contrarian players 3. These are price points where limit orders are set by market-makers. You can find out more by reading the tutorial on The Magical 100% Fibonacci Projection