
Microchip Technology Incorporated (NASDAQ:MCHP) recently provided an update on fourth-quarter fiscal 2019 outlook.
The company now anticipates fourth-quarter revenues to be in the band of $1.279 billion to $1.375 billion, compared with prior range of $1.251-$1.403 billion. Notably, the change in the guided range reflects unchanged mid-point of $1.327 billion.
Per the press release, management notes that it is revising the range of revenues, as it is skeptical of whether there will be an addition or reduction in inventory levels at its distributors.
The Zacks Consensus Estimate for revenues is pegged at $1.33 billion, indicating year-over-year growth of 32.6%.
Non-GAAP earnings per share have now been forecast in the range of $1.30-$1.49 per share, compared with the previous guided range of $1.26-$1.53. In this case as well, the change in the guided range reflects unchanged midpoint of $1.395 per share.
Notably, in the past couple of months, analysts have become increasingly cautious on Microchip’s financial performance with estimates moving south and no movement in the opposite direction.
In fact, in the past 30 days, the Zacks Consensus Estimate for current quarter earningsmoved down 10.9% to $1.31 per share. The consensus estimates indicate decline of 1.7% from the year-ago quarter.
Microchip’s CEO, Steve Sanghi believes that excluding further negative developments pertaining to trade war between the United States and China, “the March 2019 quarter will mark the bottom of the current cycle for Microchip.”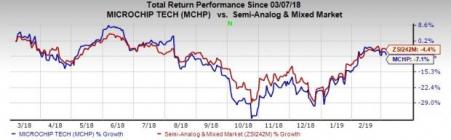
Coming to share price performance, Microchip stock has plunged 7.1% in the past year, compared with industry’s decline of 4.4%.
Other Notable Points
The company provided no other updates on the remaining financial metrics. Per the previous guidance, management anticipated non-GAAP gross margin in the 61.2-61.8% range. Non-GAAP operating expenses, as percentage of sales, are projected at 25.8-26.5%, and operating margin is expected at 34.7-36%.
Microchip's inventory days in the impending quarter are expected between 123 and 133 days. Capital expenditures are estimated in the range of $50 million.
Q3 at a Glance
Microchip delivered third-quarter fiscal 2019 non-GAAP earnings of $1.66 per share, surpassing the Zacks Consensus Estimate by $1.57 per share. The figure was also above the higher end of management’s guided range of $1.49-$1.64 per share and surged from $1.36 per shares reported in the year-ago quarter.
The year-over-year upside was driven by higher net sales, increasing 42.4% from the year-ago quarter to $1.416 billion on a non-GAAP basis. The figure also marginally outpaced the Zacks Consensus Estimate of $1.402 billion and was toward the higher end of management’s guided range of $1.362-$1.438 billion. The company benefited from robust demand for 8-bit, 16-bit and 32-bit microcontrollers.
Wrapping Up
Microchip’s strength in microcontroller business holds promise in the longer haul. We believe the company is well poised to capitalize on Microsemi’s growth catalysts. Apart from a robust portfolio, the buyout is likely to expand Microchip’s total addressable markets.
However, management remains cautious over few emerging concerns. Increasing lead time, slim demand trends in ZTE (HK:0763) and Bitcoin business domains are headwinds. Further, significant exposure to Asian markets amid imposition of tariff owing to trade war between the United States and China remains an overhang.
Furthermore, unfavorable movement in exchange rates continue to adversely impact the top line of the company and undermine its growth potential to some extent. Microchip has a highly leveraged balance sheet which adds to its woes.
Zacks Rank & Key Picks
Currently, Microchip carries a Zacks Rank #4 (Sell).
Some better-ranked stocks in the broader technology sector are Cadence Design Systems, Inc (NASDAQ:CDNS) , Synopsys, Inc. (NASDAQ:SNPS) and Symantec Corporation (NASDAQ:SYMC) , each sporting a Zacks Rank #1 (Strong Buy). You can see the complete list of today’s Zacks #1 Rank stocks here.
Cadence Design, Synopsys and Symantec have a long-term earnings growth rate of 12%, 10% and 7.9%, respectively.
Today's Best Stocks from Zacks
Would you like to see the updated picks from our best market-beating strategies? From 2017 through 2018, while the S&P 500 gained +15.8%, five of our screens returned +38.0%, +61.3%, +61.6%, +68.1%, and +98.3%.
This outperformance has not just been a recent phenomenon. From 2000 – 2018, while the S&P averaged +4.8% per year, our top strategies averaged up to +56.2% per year.
See their latest picks free >>
Cadence Design Systems, Inc. (CDNS): Free Stock Analysis Report
Synopsys, Inc. (SNPS): Free Stock Analysis Report
Symantec Corporation (SYMC): Free Stock Analysis Report
Microchip Technology Incorporated (MCHP): Free Stock Analysis Report
Original post
Zacks Investment Research
- English (UK)
- English (India)
- English (Canada)
- English (Australia)
- English (South Africa)
- English (Philippines)
- English (Nigeria)
- Deutsch
- Español (España)
- Español (México)
- Français
- Italiano
- Nederlands
- Português (Portugal)
- Polski
- Português (Brasil)
- Русский
- Türkçe
- العربية
- Ελληνικά
- Svenska
- Suomi
- עברית
- 日本語
- 한국어
- 简体中文
- 繁體中文
- Bahasa Indonesia
- Bahasa Melayu
- ไทย
- Tiếng Việt
- हिंदी
Microchip (MCHP) Guides Lower Earnings & Revenues In Q4
Published 03/05/2019, 08:43 PM
Updated 07/09/2023, 06:31 AM
Microchip (MCHP) Guides Lower Earnings & Revenues In Q4
Latest comments
Loading next article…
Install Our App
Risk Disclosure: Trading in financial instruments and/or cryptocurrencies involves high risks including the risk of losing some, or all, of your investment amount, and may not be suitable for all investors. Prices of cryptocurrencies are extremely volatile and may be affected by external factors such as financial, regulatory or political events. Trading on margin increases the financial risks.
Before deciding to trade in financial instrument or cryptocurrencies you should be fully informed of the risks and costs associated with trading the financial markets, carefully consider your investment objectives, level of experience, and risk appetite, and seek professional advice where needed.
Fusion Media would like to remind you that the data contained in this website is not necessarily real-time nor accurate. The data and prices on the website are not necessarily provided by any market or exchange, but may be provided by market makers, and so prices may not be accurate and may differ from the actual price at any given market, meaning prices are indicative and not appropriate for trading purposes. Fusion Media and any provider of the data contained in this website will not accept liability for any loss or damage as a result of your trading, or your reliance on the information contained within this website.
It is prohibited to use, store, reproduce, display, modify, transmit or distribute the data contained in this website without the explicit prior written permission of Fusion Media and/or the data provider. All intellectual property rights are reserved by the providers and/or the exchange providing the data contained in this website.
Fusion Media may be compensated by the advertisers that appear on the website, based on your interaction with the advertisements or advertisers.
© 2007-2024 - Fusion Media Limited. All Rights Reserved.