Methode Electronics (NYSE:MEI) delivered fourth-quarter fiscal 2019 earnings of 62 cents per share, which lagged the Zacks Consensus Estimate by 8 cents and declined 31.1% year over year.
Net sales increased 6.8% year over year to $266 million. However, the figure lagged the Zacks Consensus Estimate of $277 million. Unfavorable currency exchange (weaker Euro and RMB against the U.S. dollar) hurt sales by $8.8 million.
Sales from Grakon was $51.8 million in the reported quarter. New product launches contributed $3 million to sales.
However, the company’s shares have declined 2.2% to close at $26.40 on Jun 21, following the results. The downside was apparently caused by lower first-quarter sales expectations compared with the same in the trailing three quarters in fiscal 2020.
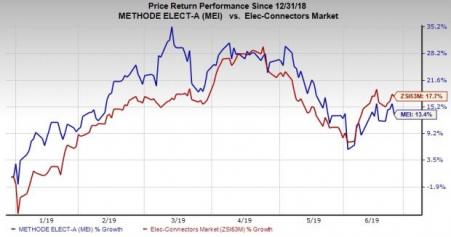
Methode Electronics shares have returned 13.4% year to date compared with the industry’s rise of 17.7%.

Top-Line Details
Automotive segment sales declined 7.8% on a year-over-year basis.
Sales in Asia plunged almost 34% due to decline in hidden switch product and transmission lead-frame assembly volumes. Lower passenger car demand and production as well as pricing reductions continued to negatively impact sales in the segment.
Europe sales also declined 17.4% due to lower hidden switch sales volume, partially negated by improved sensor products sales volume.
However, North America sales climbed 2% due to $13.2 million contribution from Grakon.
Industrial segment jumped 124.8% year over year, driven by 317.6% surge in North America sales on the back of Grakon ($36.1 million contribution).
Sales in Europe increased 34.3%, courtesy of $2-million contribution from Grakon in the reported quarter. Moreover, improved busbar and radio remote control product volumes positively impacted sales.
However, sales in Asia declined 8.2% due to lower busbar product volume.
Net sales in the Interface segment declined 24.3% due to delayed launch of a major appliance program and lower legacy data solution product volume.
Medical net sales increased to $0.4 million from $0.1 million in the year-ago quarter.
Dabir sales hit $1 million and the company sold 462 Surfaces in fiscal 2019.
Operating Details
Gross margin on a non-GAAP basis expanded 170 basis points (bps) year over year to 26.6%. The upside can be attributed to improved business mix in the Industrial segment and the weakening of Mexican peso compared with the U.S. dollar.
Industrial segment gross margin expanded 650 bps. However, automotive segment gross margin contracted 150 bps due to lower sales volume, unfavorable sales mix, pricing reductions as well as expenses for initiatives to reduce overall costs and improve operational profitability. Lower sales from Interface segment negatively impacted gross margin.
Adjusted EBITDA margin expanded 190 bps on a year-over-year basis to 17.7%.
Operating expenses on a GAAP basis were flat year over year at 13.8%. Selling, general and administrative (SG&A) expenses fell 110 bps to 11.9%. Decline in SG&A expenses can be primarily attributed to lower bonus and legal expenses.
Non-GAAP operating margin expanded 170 bps to 12.8%.
Cash & Free Cash Flow
Methode Electronics exited the fiscal with cash and cash equivalents of $83.2 million.
As of Apr 27, 2019, free cash flow was $85.1 million compared with $37.6 million as of Apr 28, 2018.
Guidance
For fiscal 2020, Methode Electronics expects sales between $1.130 billion and $1.170 billion.
EBITDA is projected at $221 million compared with $155 million in fiscal 2019. New product launches that include Ford integrated Tailgate Module and Overhead Consoles programs coupled with Laundry platform (expected to be launched in third-quarter fiscal 2020) and E-bike programs are expected to boost EBITDA growth.
Pre-tax income is expected in the range of $150.3-$164.3 million.
Earnings are expected in the range of $3.25-$3.55 per share.
Moreover, capital expenditure is expected between $48 million and $54 million. Free cash flow is anticipated between $122 million and $136 million.
Zacks Rank & Stocks to Consider
Methode Electronics currently carries a Zacks Rank #3 (Hold).
Some better-ranked stocks in the broader technology sector include Bruker (NASDAQ:BRKR) , Cirrus Logic (NASDAQ:CRUS) and Universal Display (NASDAQ:OLED) . All the three stocks flaunt a Zacks Rank #1 (Strong Buy). You can see the complete list of today’s Zacks #1 Rank stocks here.
Long-term earnings growth rate for Bruker, Cirrus Logic and Universal Display are currently pegged at 12.3%, 15% and 30%, respectively.
More Stock News: This Is Bigger than the iPhone!
It could become the mother of all technological revolutions. Apple (NASDAQ:AAPL) sold a mere 1 billion iPhones in 10 years but a new breakthrough is expected to generate more than 27 billion devices in just 3 years, creating a $1.7 trillion market.
Zacks has just released a Special Report that spotlights this fast-emerging phenomenon and 6 tickers for taking advantage of it. If you don't buy now, you may kick yourself in 2020.
Click here for the 6 trades >>
Cirrus Logic, Inc. (CRUS): Free Stock Analysis Report
Universal Display Corporation (OLED): Free Stock Analysis Report
Methode Electronics, Inc. (MEI): Free Stock Analysis Report
Bruker Corporation (BRKR): Free Stock Analysis Report
Original post
Zacks Investment Research
