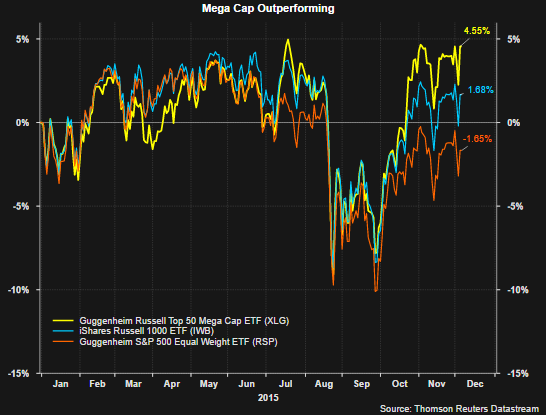
One aspect of the market recovery since the August/September lows has been the narrow market breadth. The Russell 1000 Index return has been held up by the large mega cap stocks within the index. This has been the case for the S&P 500 Index as well. As the below chart shows, the yellow line representing the year to date return for the Guggenheim Russell Top 50 Index (N:XLG) has outpaced both the iShares Russell 1000 Index (N:IWB) return and the Guggenheim S&P 500 Equal Weight Index (N:RSP) return.

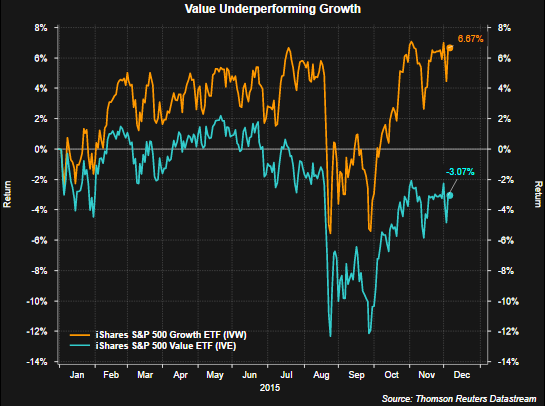
The other phenomenon occurring this year is the wide disparity in performance of growth and value stocks. The below chart shows growth stocks within the S&P 500 Index are outperforming the value stocks within the index by nearly ten percentage points.
The value index is being weighed down by several of its top weighted sectors like energy and industrials. Additionally, both Exxon Mobil (N:XOM) and Chevron (N:CVX)are represented in the top 10 holdings in the iShares S&P 500 Value Index (N:IVE) and energy broadly has been one of the weakest market sectors.

It seems one can not give away some of the industrial and energy companies.
Recent headwinds of a strong US dollar and low energy prices have negatively impacted many industrial and energy stocks. With the Fed seemingly near liftoff for interest rates, further dollar strength is likely and will continue to pressure multinational companies like industrial and energy firms.
A silver lining is the fact that year- over-year comparisons for energy prices and the dollar begin to get easier starting in the first quarter of 2016. This would put less negative pressure on earnings growth for some of these companies through 2016, all else being equal.
