It’s become difficult to distinguish the efficacy of various index weighting strategies that pervade the ETF universe. Some work best during specific market cycles or are designed to take advantage of distinguishable trends. Others are tailor-made for the long-term with the broad diversification, reasonable costs, and sensible philosophy that investors can identify with.
It’s these latter characteristics that best describe the revenue-weighted index methodology that is delivered by a select group of Oppenheimer funds. The Oppenheimer Large Cap Revenue (NYSE:RWL) is a fund that was born during the nascent months of the great financial crisis and has risen from those dark times with an impressive track record.
This ETF is built on a simple premise – take the 500 stocks in the S&P 500 Index and re-distribute the weightings based on top line revenue versus the traditional market capitalization criteria. The result is the same level of large-cap stock diversification with a much different distribution of capital in the underlying portfolio.
For example, almost everyone is familiar with the high concentration of technology stocks led by Apple Inc (NASDAQ:AAPL) and Microsoft Corp (NASDAQ:MSFT) in the conventional SPDR S&P 500 ETF (NYSE:SPY). Technology companies make up nearly 23% of the SPY portfolio right now.
While these stocks are still represented in RWL, they take on a lesser role based on their comparative revenue numbers. Wal-Mart Stores Inc (NYSE:WMT) is the largest holding based on its dominant global sales footprint. AAPL is the number two holding, followed by Berkshire Hathaway (NYSE:BRKa) and Exxon Mobil Corp (NYSE:XOM).
Overall, the top sector weightings in RWL are much more evenly distributed than in SPY. Consumer discretionary is the foremost group with 16.10% of the total portfolio, followed by health care at 15.8%. Technology only represents 11.3% of the asset allocation - less than half of the SPY exposure.
The impact of that redistribution is to tilt the RWL portfolio towards heavier exposure in value-oriented stocks. In fact, Morningstar categorizes the fund in its large-cap value group and has given it a 5-star rating over the 3 and 5-year periods ending 4/30/17. Many of its fundamental statistics, such as Price/Earnings and Price/Sales ratio, are more closely aligned with comparable value funds as well.
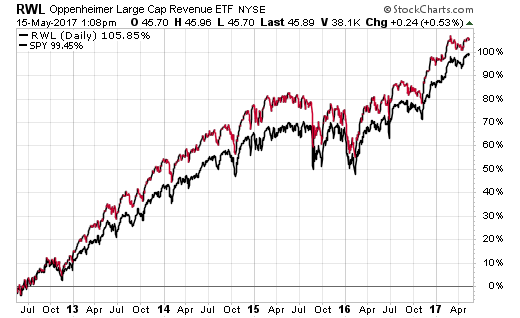
An overlay of the 5-year track record of SPY and RWL demonstrates that this smart beta ETF has been a top performer versus the benchmark over that time frame.

This fund has demonstrated the capability to stay correlated with the market and deliver solid returns based on its unique methodology. This is important because RWL also charges a modestly higher fee as well. It boasts a net expense ratio of 0.39% versus just 0.095% in SPY.
That expense is still quite reasonable and makes this type of holding suitable as a core equity position for those that want to differentiate their portfolio away from the market-cap benchmark. Investors are clearly taking notice as well. According to fund flow data from ETF.com, $257 million has flowed into RWL over the last year and the fund’s current assets now stand at over $630 million.
It’s also worth noting that the same fund family boasts smaller company exposure in the Oppenheimer Mid Cap Revenue (NYSE:RWK) and Oppenheimer Small Cap Revenue (NYSE:RWJ). They also just released two new ETFs that utilize the revenue-weighted method on ESG stocks. ESG is otherwise known as public companies that are friendly towards environmental, social, and governmental issues.
The Bottom Line
The field of large-cap ETFs and mutual funds is one of the most crowded categories in all of investing. Nevertheless, the revenue weighted methodology stands tall as a sound and reliable index strategy. Investors should always be forewarned that any smart beta index will go through phases of outperformance and underperformance over varying cycles. It’s the ability to stick with a proven method over the long-term that generally leads to the best results.
The views and opinions expressed herein are the views and opinions of the author and do not necessarily reflect those of Nasdaq, Inc.
