Momentum-based investing strategies may be one of the most reliable drivers of alpha, but like all sources of excess return this factor premium waxes and wanes through time. Accordingly, deciding when to exit the trade (or reduce exposure to it) is no less critical than determining when to jump on the gravy train.
Research Affiliates recently advised that “momentum can be divided into fresh and stale momentum, with very different results.” In other words, trending behavior has a life cycle, which implies that hopping on the bandwagon in the later stages of a momentum rally carries more risk than establishing new positions relatively early. Quantifying where we are at any given point for a momentum trade, however, is open to debate, but we can start by calculating some basic statistics as a benchmark.
As an example, consider how the US stock market currently ranks for positive momentum, defined as the S&P 500’s 50-day average above the 200-day average. This is far from the last word on measuring momentum, but it’s a reasonable way to begin.
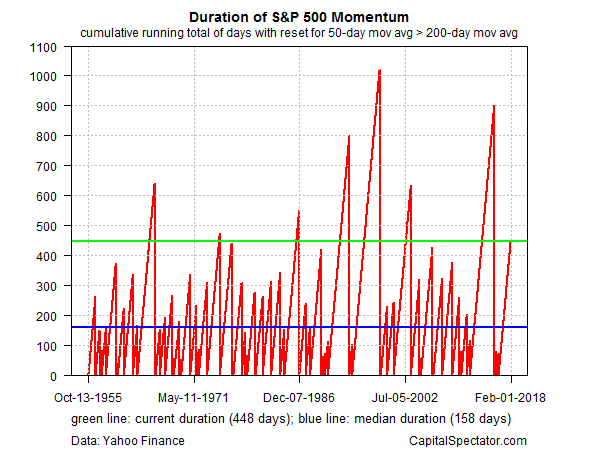
The focus here is calculating a running total of days when the S&P’s 50-day average exceeds the 200-day average. When the shorter average falls below the longer average, the bull run ends. The clock resets the next time the 50-day price rises above the 200-day price.
Crunching the daily numbers on this front since 1955 through yesterday’s close (Feb. 1) reveals that the current bull run has been in force for 448 trading days, which equates with the 88th percentile for the duration of momentum runs over the past half century, based on the 50-day/200-day setup defined above. Since 1955, there have only been seven momentum runs that have lasted longer, including the 1,020-day monster rally that finally expired in Sep. 1998.

The current momentum rally is arguably long in the tooth, but history suggests there may be more room to run. Nonetheless, it’s late in the day for this party, or so it appears via the parameters outlined above.
There are other methods for defining momentum, of course, and so it’s prudent to consider how the S&P stacks up from several perspectives before making any final decisions. Keep in mind, too, that the 50-day/200-day relationship isn’t foolproof and is subject to false signals at times, just as every indicator is. But as a preliminary test, the numbers above still suggest caution.
After all, nothing lasts forever. The current momentum rally, approaching its second birthday, may not be stale just yet, but it’s far from fresh. There may be some kick left in this horse, but a sensible interpretation of the data suggests that the easy money has been made.
