This post was written exclusively for Investing.com
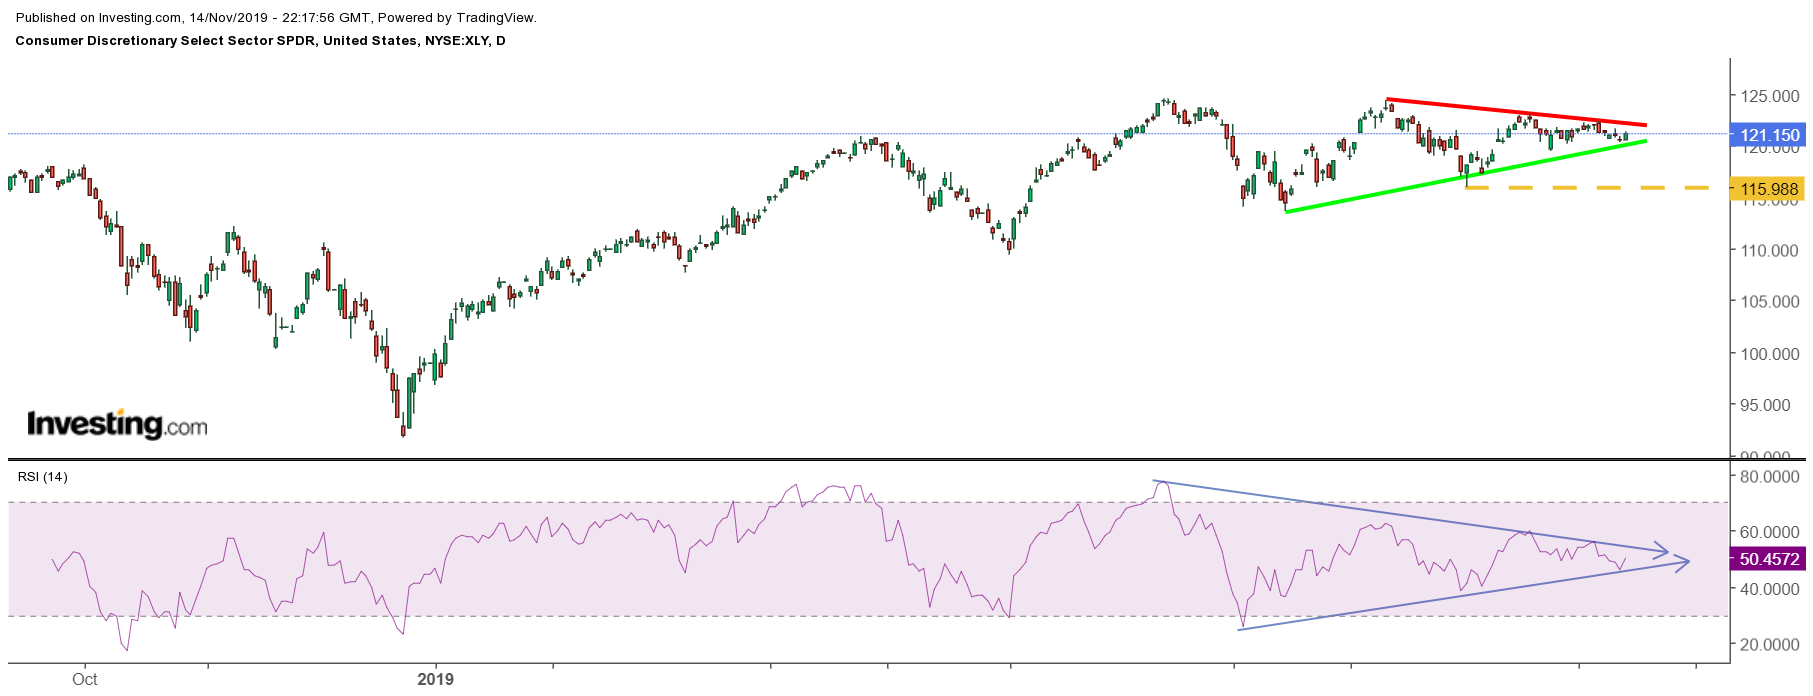
The consumer discretionary sector, as measured by the Consumer Discretionary Select Sector SPDR (NYSE:XLY), has risen by over 22% thus far in 2019, underperforming the broader S&P 500, which has increased by more than 23%. The group started to underperform the broader equity market after it began to slide in the middle of September. The big problem is that these declines may only grow worse.
You can blame the top three stocks in the ETF for the lack of performance, Amazon.com Inc (NASDAQ:AMZN), Home Depot Inc (NYSE:HD) and McDonald’s Corporation (NYSE:MCD). Combined, the three companies make up roughly 30% of the sector based on their weightings. Amazon is by far the largest weighted stock, accounting for 22%, double that of Home Depot at 11%, and more than triple McDonald’s weighting of 6.5%.
More Declines Ahead?
The consumer discretionary ETF has dropped by about 2% since the middle of September. The problem is that the S&P 500 has been rising. Now the technical chart shows that the ETF is testing a key level of technical support at an uptrend, which started in August. Should the ETF break down and fall below support, it could drop to around $116—a decline of an additional 4.2% from its price of roughly $121 on November 14.
The relative strength index (RSI) has generally been trending lower since the ETF peaked in mid July. This would suggest that bullish momentum is leaving the sector and that the stock could be due to fall.

McDonald’s Sinks
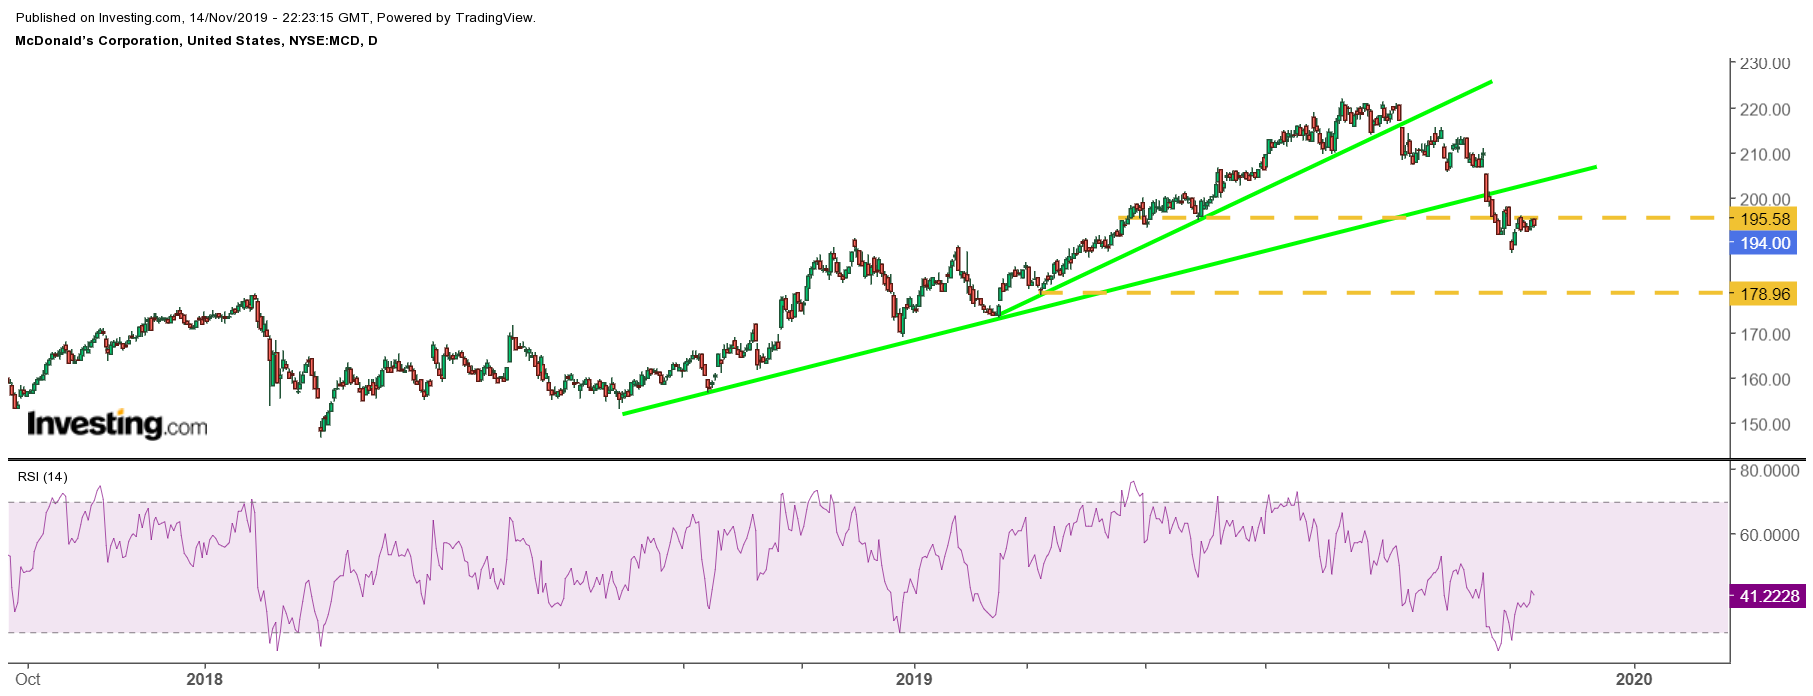
McDonald’s has witnessed the sharpest decline, dropping by almost 11% since Sept. 9. The steep drop only grew worse by mid-October after the company reported weaker-than-expected quarterly results, followed by the departure of its CEO just a few weeks later. The stock has broken a long-term uptrend that has been in place since August 2018. Now, the equity finds itself failing at a key level of technical resistance around $195, which could result in the stock falling even further to as low as $178.50.

Amazon Has Stalled Out
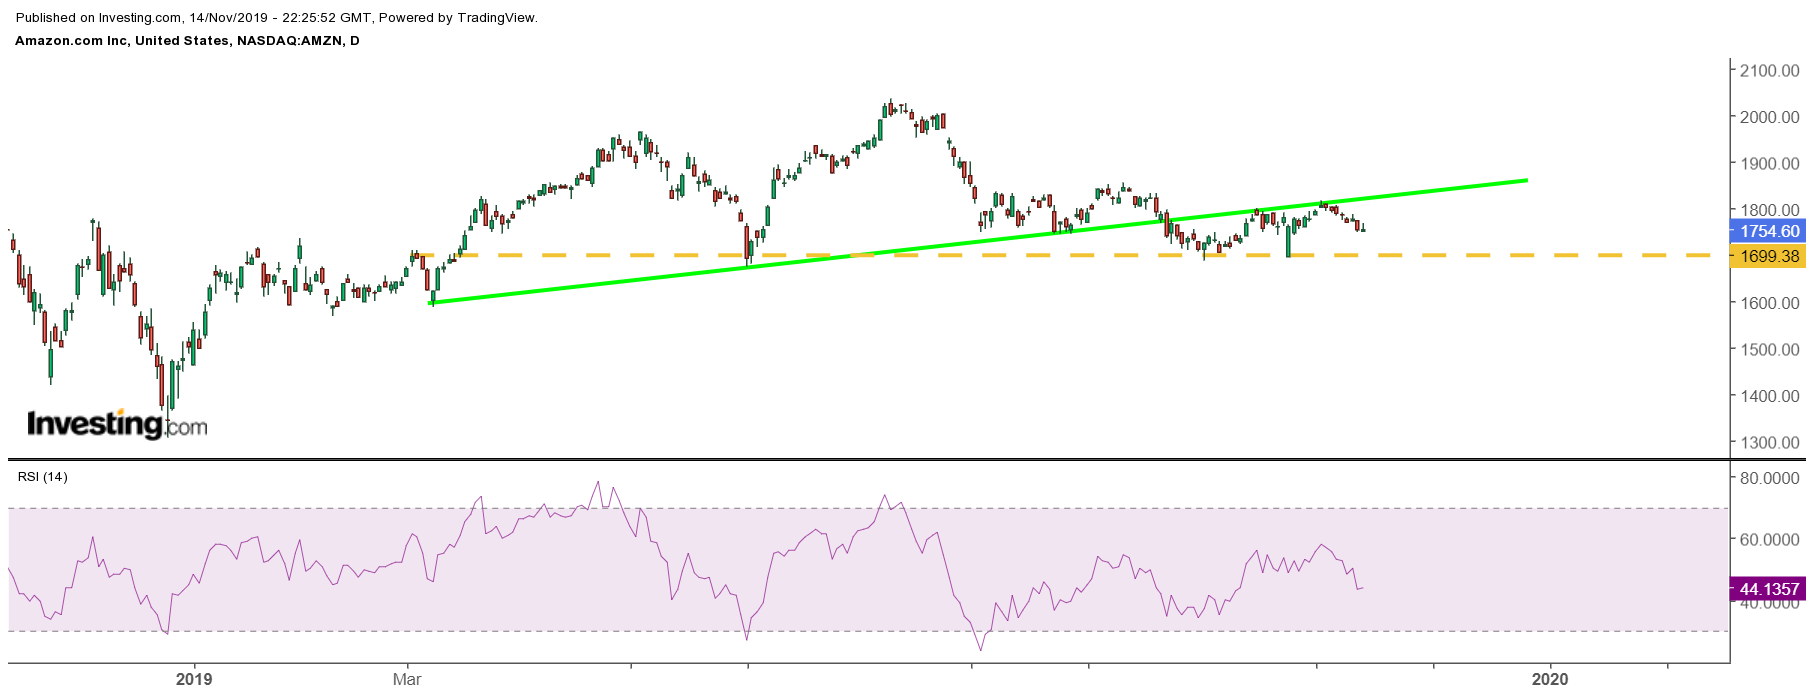
Amazon’s stock hasn’t performed much better, falling by over 4% over the same period. Amazon’s stock has essentially traded sideways since the end of July after it also reported weaker-than-expected earnings. Its stock also broke an uptrend that started in March 2018, and it too finds itself in jeopardy of falling further, potentially to around $1,700.

Can Home Depot Save The Group?
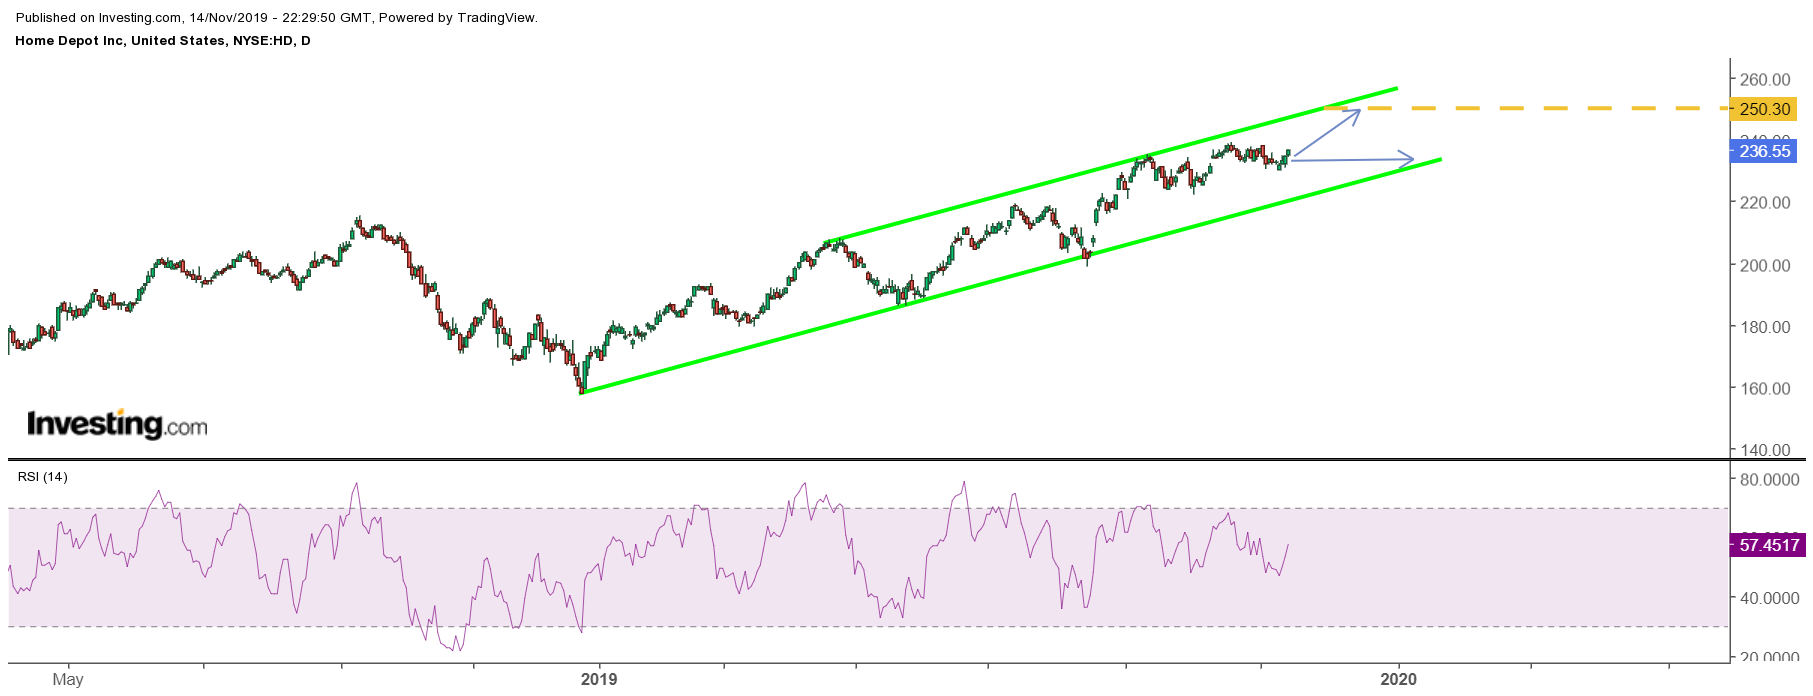
Home Depot has performed the best out of the group, rising by over 1% during that same period, but that is still far worse than the S&P 500 gain of almost 4% over that same time. Compared with its two consumer peers, Home Depot’s chart does appear to be the strongest, rising in a long-term trading channel that started in late 2018. But based on that channel, gains in the future may be limited, with shares perhaps rising to around $250—an increase of about 6% from its current price of roughly $236. However, it seems more likely that shares consolidate sideways over the next several weeks, heading back to the lower end of the channel.

The consumer discretionary sector may continue to struggle in the weeks ahead if the three stocks mentioned above can’t get their acts together. They are incredibly important to the success of the group: should they fall more, then it is likely that the whole sector goes lower with them.
