In recent years, equities have been carried higher by several compounding effects: economic growth, expanding profit margins and expanding multiples.
These three things, by definition, determine equity prices (if we assume that gross sales are tied to economic growth):
- Price = Price/Earnings x Earnings/Sales x Sales
When all three are rising, as they have been, it's a strong elixir for stock prices. Which explains why stock prices are so high. But the devil is in predicting these components, of course -- no mean feat.
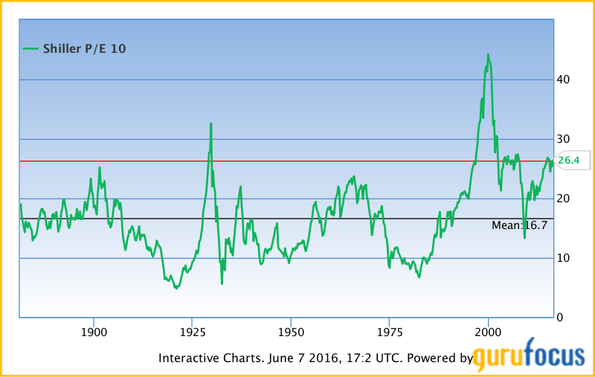
Yet we can make some observations. For some time, P/E ratios have been extremely high by historical measures, with the Shiller Cyclically-Adjusted P/E ratio (NYSE:CAPE) roughly doubling since the bottom in 2009. With the exception of the equity bubble in 1999-2000, the CAPE has not been much higher than it is now, at 26.4 (see chart). This should come as no surprise to anyone who follows markets regularly.
source Gurufocus
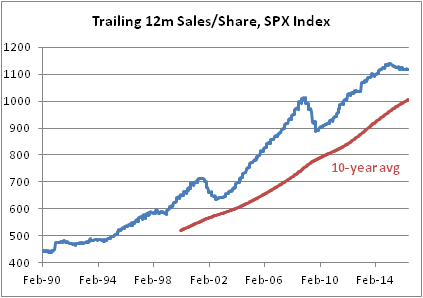
Recently sales have been declining. However, on a rolling 10-year basis, the rise has been reasonably steady as the chart below illustrates. Over the last 10 years, sales per share have risen about 2.85% per year.

Source: Bloomberg
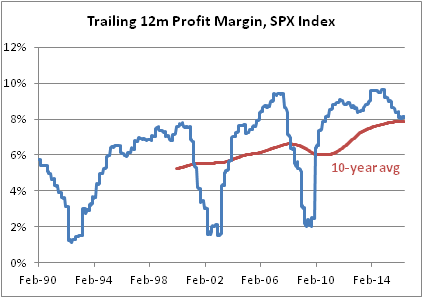
Finally, profit margins have recently been elevated. In fact, they have been high for a long time; the 10-year average profit margin for the S&P 500 has risen to 8% from 6% only a few years ago. Recently, however, profit margins have been receding.

Both the rise and fall in profit margins make some sense. Value creation at the company level must be divided between the factors of production: land, labor and capital. When there is substantial unemployment, labor has little bargaining power and capital tends to claim a higher share. Moreover, labor’s share is relatively sticky, so that speculative capital absorbs much of the business-cycle volatility in the short run. This is the trade-off between buyers and sellers of labor.
I used 10-year averages for all of these so that we can use CAPE; other measures of P/E are fraught. So, if we take 26.4 (CAPE) times 7.84% (10-year average profit margin) times 1005.55 (10-year average sales), we get an S&P index value of 2081, which is reasonably close to the end-of-May value of 2097. That’s not surprising -- as I said, these three things make up the price, mathematically.
So let’s look forward. Recently, the unemployment rate has fallen -- and yes, I’m know there is more slack in the jobs picture than depicted in the unemployment rate. But the recent direction is clear -- wages have accelerated as I have documented in previous columns. It is unreasonable to expect that profit margins could stay permanently elevated at levels above all but a few historical episodes. Let’s say that over the next two years, the average drops from 7.84% to 7.25%. And let’s suppose that sales continue to grow at roughly 2.85% per year -- which means no recession -- so that sales for the S&P are at 1292 and the 10-year average at 1064.15. Then, if the long-term P/E remains at its current level, the S&P would need to decline to 2037. If the CAPE were to decline from 26.4 to, say, 22.5 (the average since 1990, excluding 1997-2002), the S&P would be at 1736.
None of this should be regarded as a prediction, except in one sense. If stock prices are going to continue to rise, then at least one of these things must be true: either multiples must expand further, or sales growth must not only become positive again but actually accelerate. Or, profit margins must stop regressing to the mean. None of these things seems like a sure thing to me. In fact, several of them seem downright unlikely.
The most malleable of these is the multiple…but it is also the most ephemeral and most vulnerable to an acceleration in inflation. We remain negative on equities over the medium term, even though I recently advanced a hypothesis about why these overvalued conditions have been so durable.

