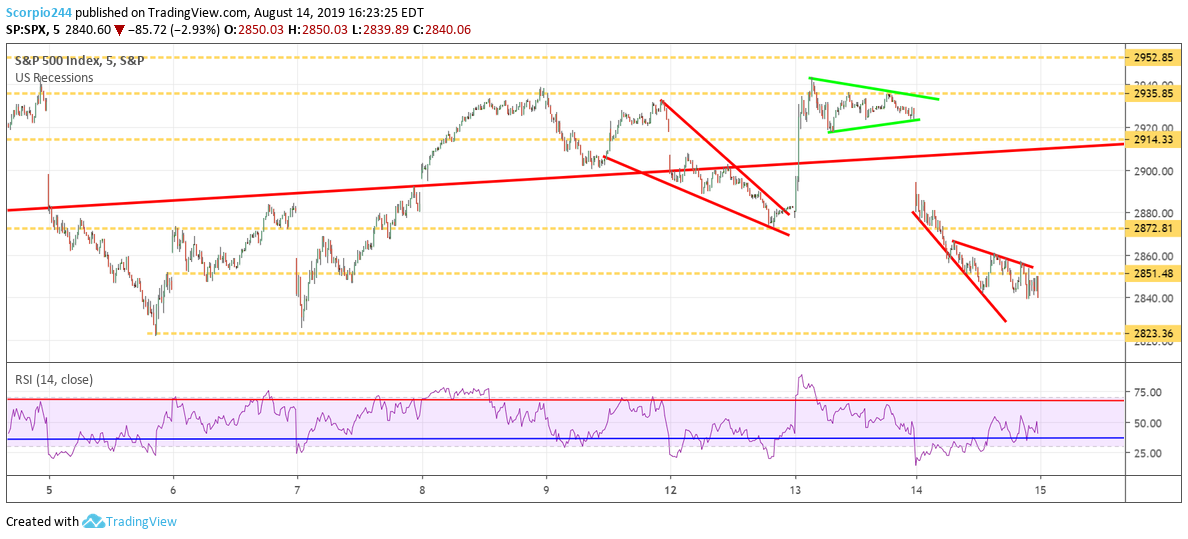
Stocks had another lousy day with the S&P 500, falling by almost 3%. If it makes you feel any better, the index is still higher than where it was on August 7. I can’t say all that much has changed since then.
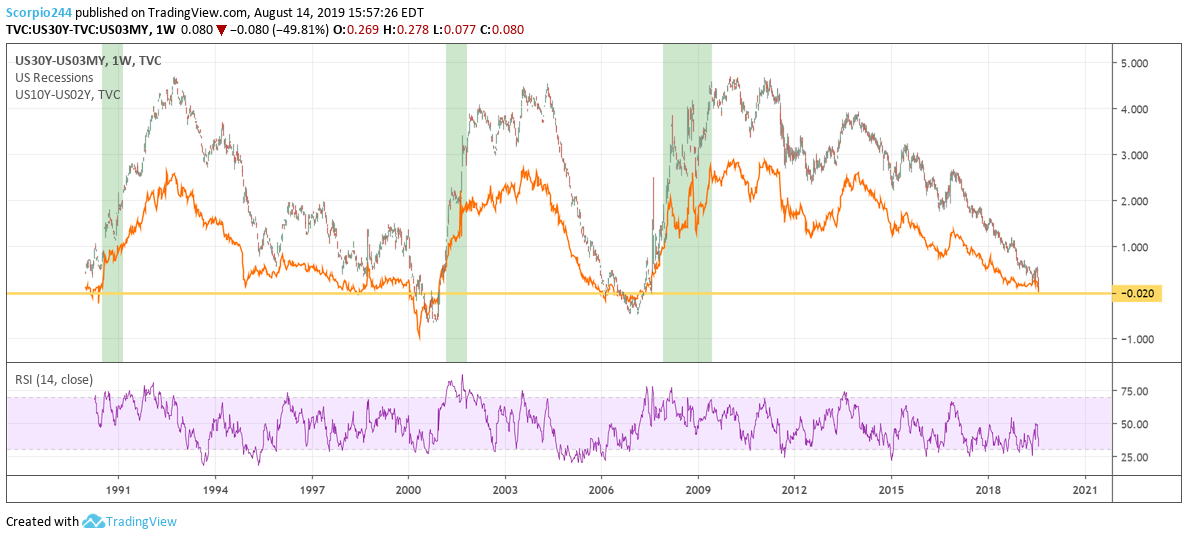
While everyone focuses on the 10-2 year spread minor inversion, the one spread that has not yet inverted is 30-year minus the three-month spread. While some will say that the 10-year minus 2-year is an indicator of recession, it is not perfect. The one that is 2 for the last 2 is the 30-Year minus the 3-Month. That has not inverted yet. So perhaps our attention should turn to something more reliable.
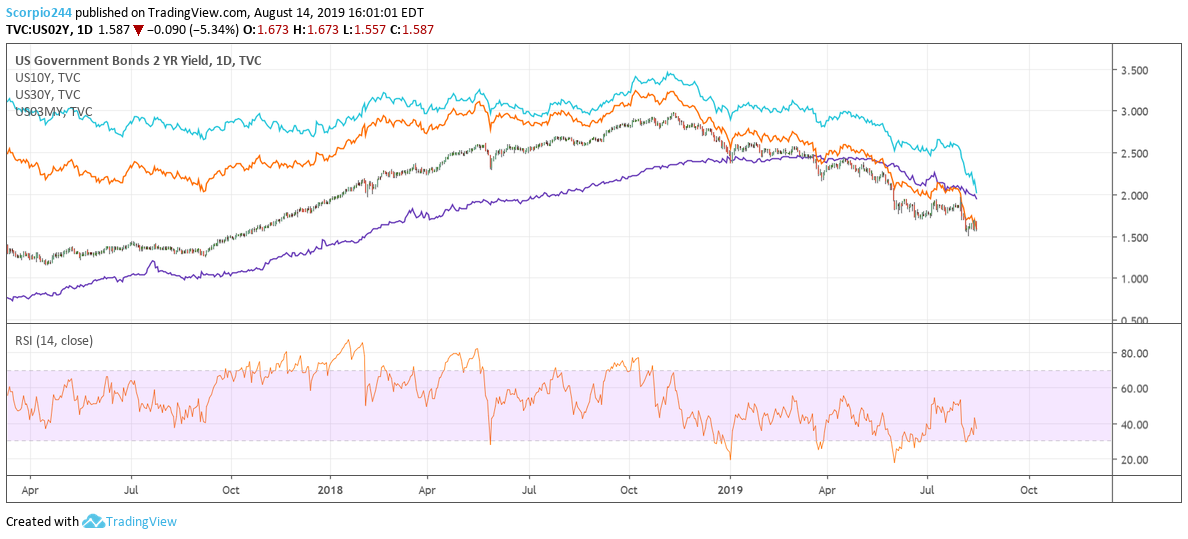
Also, the move lower in yields seems like a stock when everyone is crowding in. The move lower in yields appears a bit overdone. You can see the sharp move lower in yields starting in August following the Fed meeting.
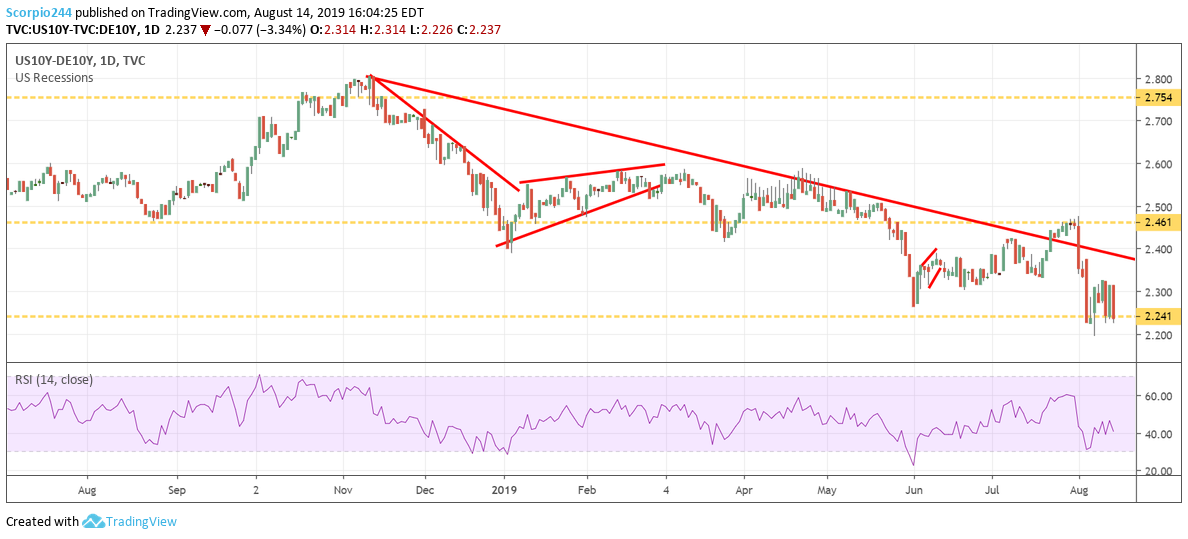
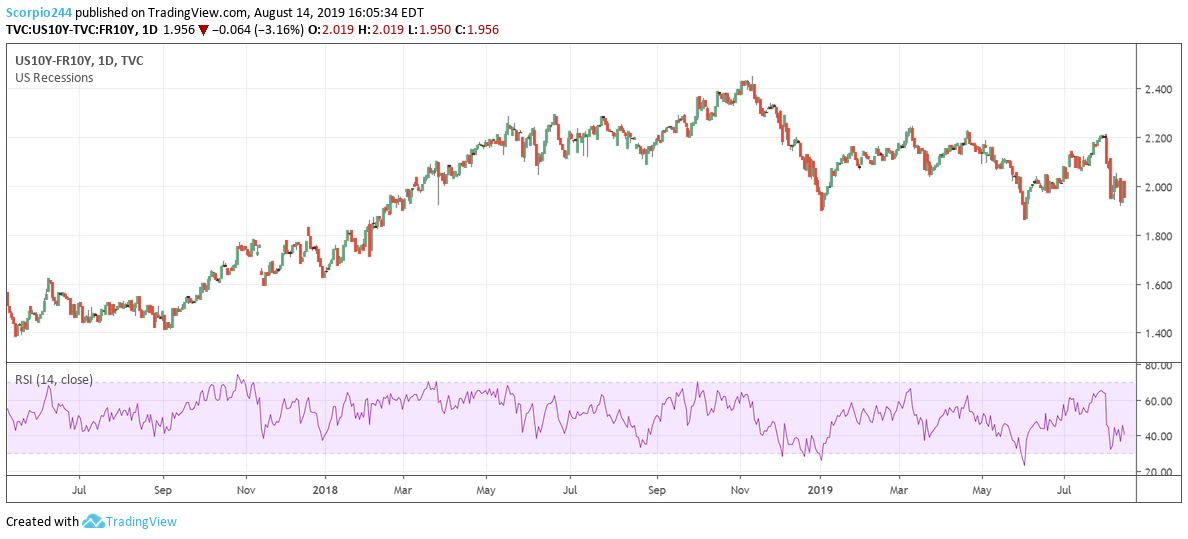
But another interesting thing is that the move lower in yields may have nothing to do with the US; look at the spread between the US 10-Year and German 10-year. It is nearly unchanged since the drop immediately following the Fed meeting.
The same is the case against France.
Even the troubled UK and the issues around Brexit have been seeing yields stay in lockstep with the US.
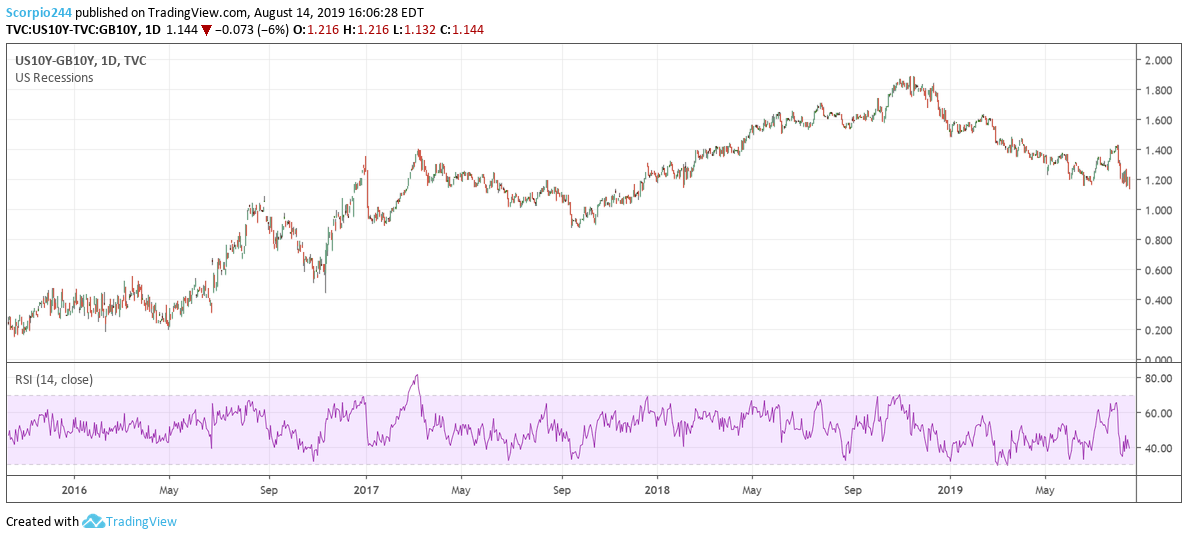
It shows that the move lower has more to do with a global flight into bonds than a US recession warning.
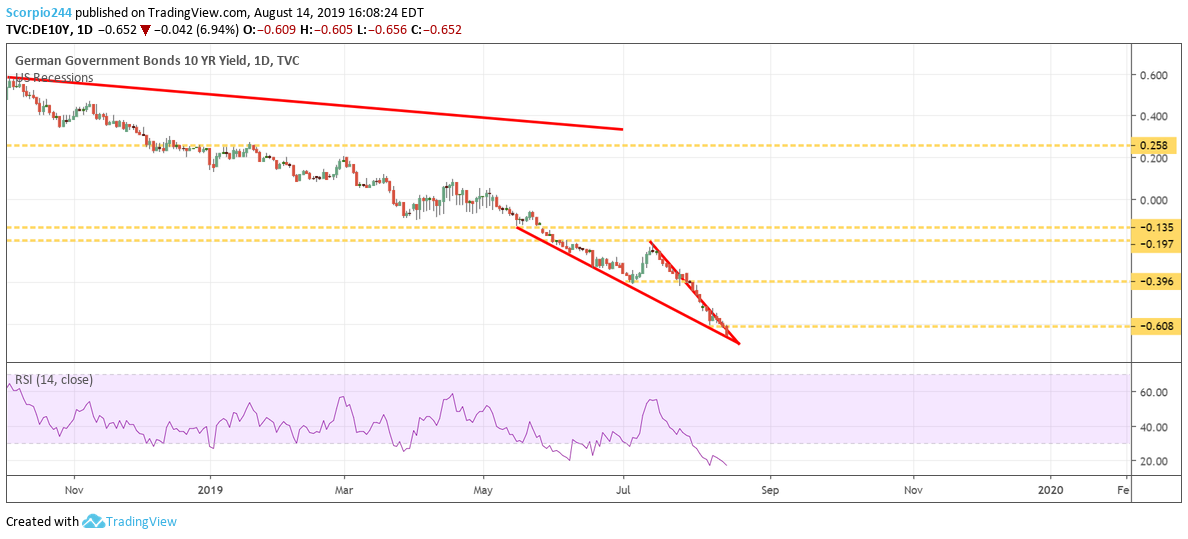
And based on the current setup in the German 10-Year bund, the global move lower in yields may be about to reverse higher. The chart shows a large falling wedge pattern, that would suggest that yields on the German 10-Year rise to around -0.4 basis points. (See: Technical Analysis 103: Reversal Patterns)
I don’t think I heard one person talk about the Fed soon being a buyer of bonds again.
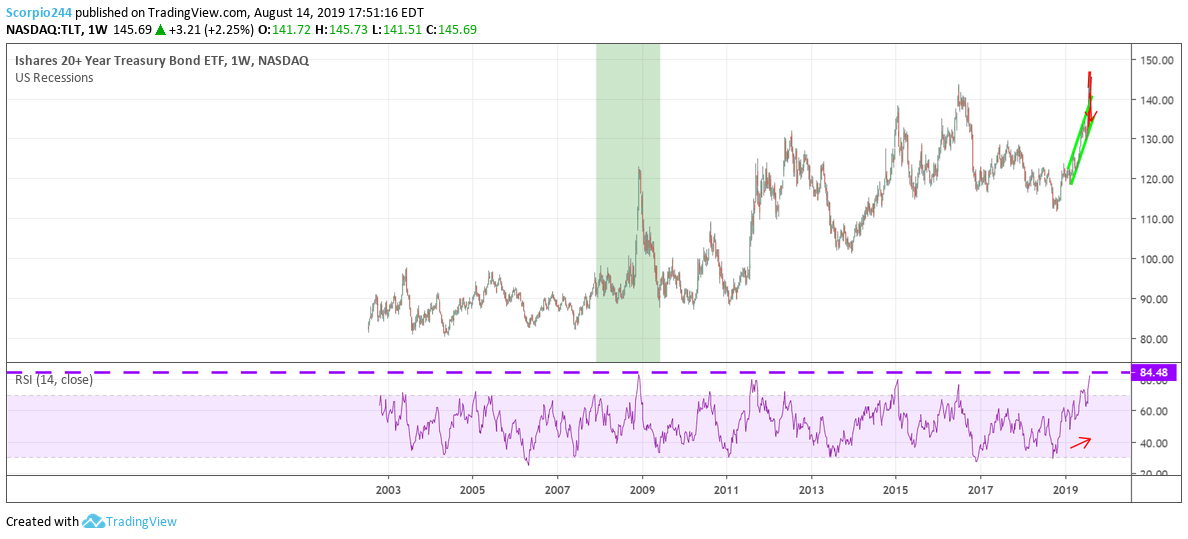
By the way, the RSI on the TLT ETF is at the highest point since 2009, at 85!. Overbought? Just a little bit.
S&P 500 (NYSE:SPY)
Anyway, the S&P 500 managed to finish at a higher level than last week. However, it seems that we may see a retest of the August lows around 2825. I’m not sure there is more to say at this point.Between the equities and yield plunging it would seem the algo’s are the only thing driving this market. It really is sad that the market has become so mechanical. These 3% days are now the equivalent of a 2% day a few ago. Unfortunately, we have to get used to.
Cisco (NASDAQ:CSCO)
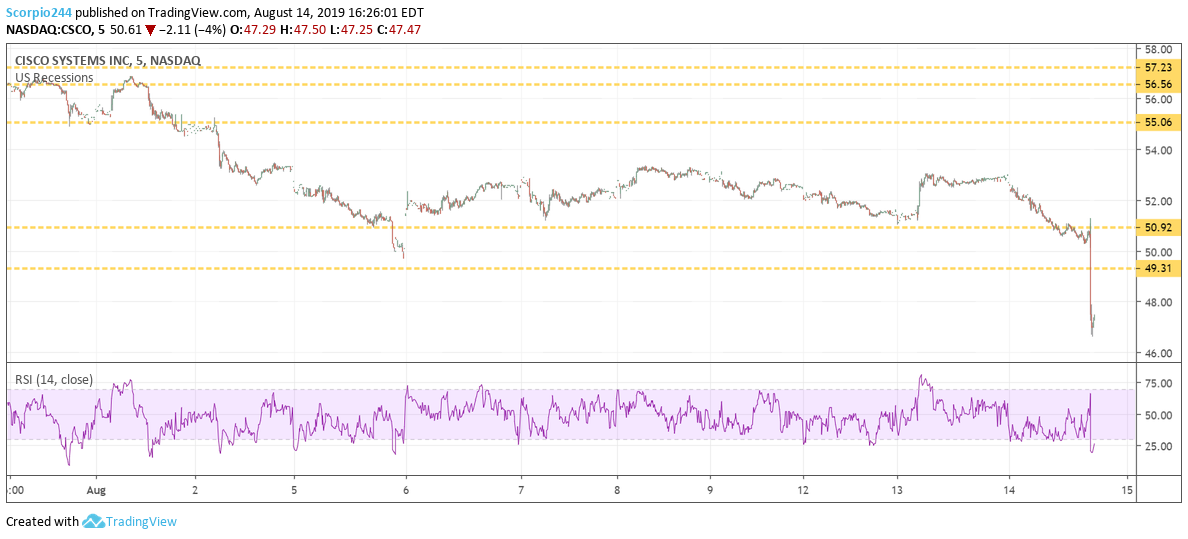
Cisco (NASDAQ:CSCO) is dropping after hours. Results topped estimates on both revenue and earnings, but fiscal first-quarter guidance fell slightly short of expectations. The market is no mood for anything, but better, so the stock is selling off some after hours. I’m in the process of listening to the conference call. At the moment the drop seems like an overreaction to me. That may change after the conference call.
The tone feels a little bit cautious to me and along with some weakness in their service provider business.
Boeing (NYSE:BA)
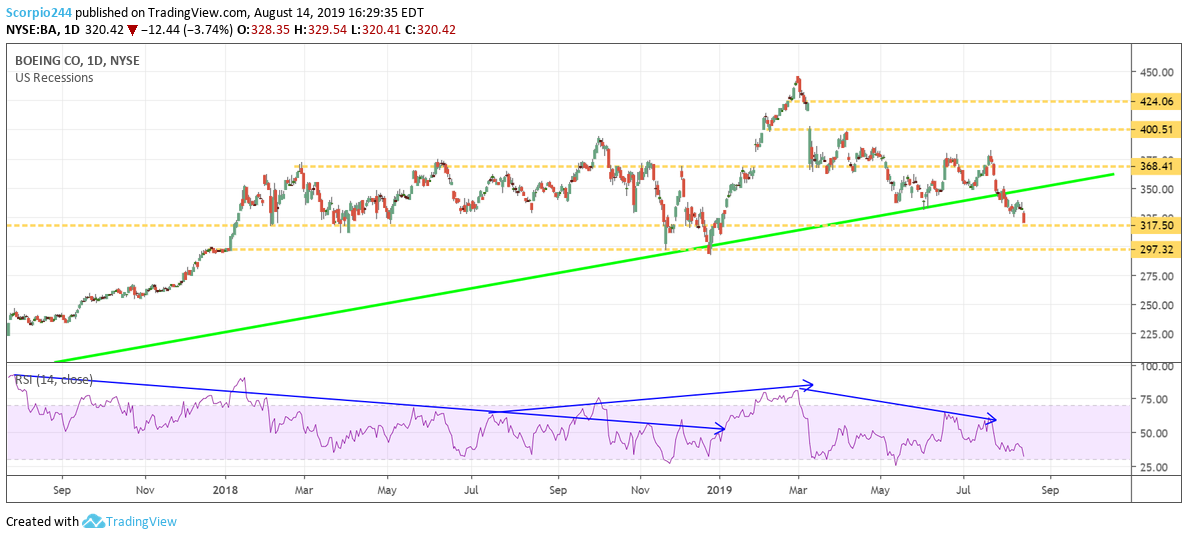
Boeing also had a big move lower and is now the cusp of a decline to $297. The last level of support comes around $317.
Citigroup (NYSE:C)
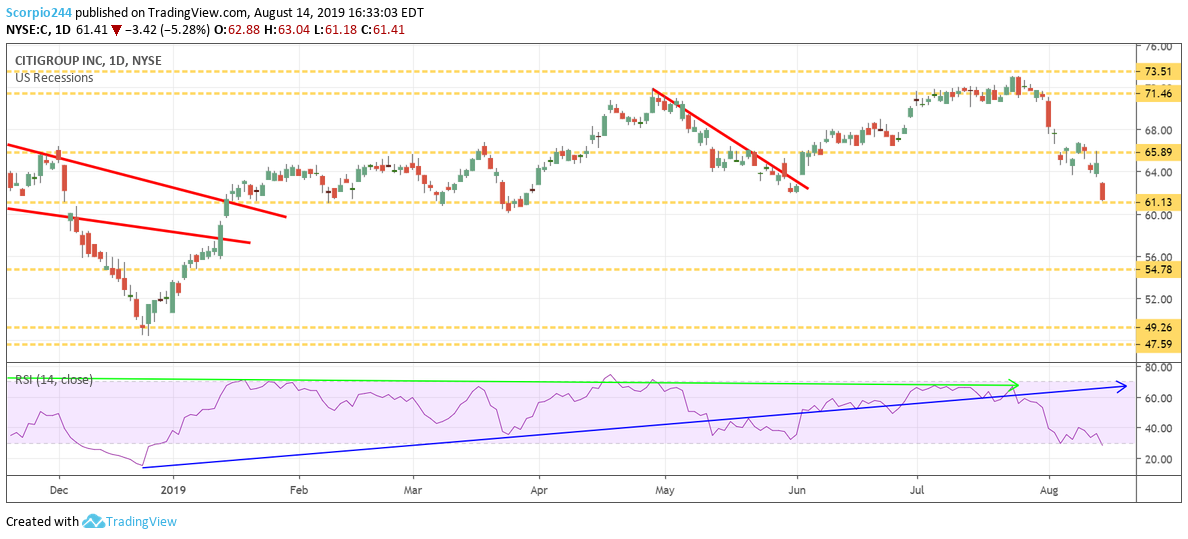
Citigroup (NYSE:C) fell to support at $61.1, and it could be on its way to $54.75 if that level doesn’t hold.
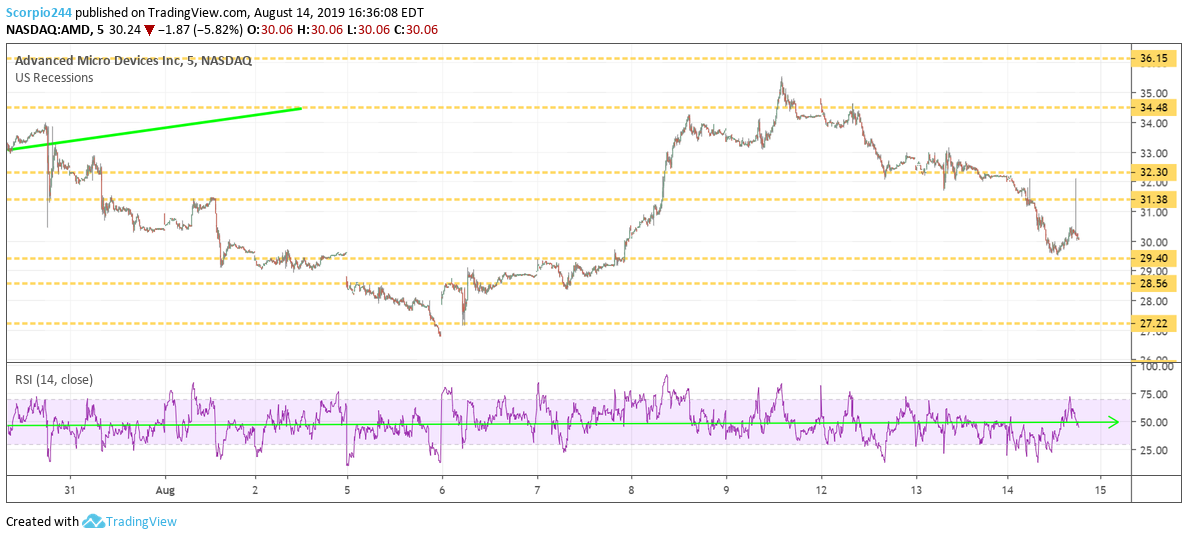
Advanced Micro Devices (NASDAQ:AMD)
AMD (NASDAQ:AMD) filled the gap at $29.40, and now, $31.40 becomes the new resistance region.
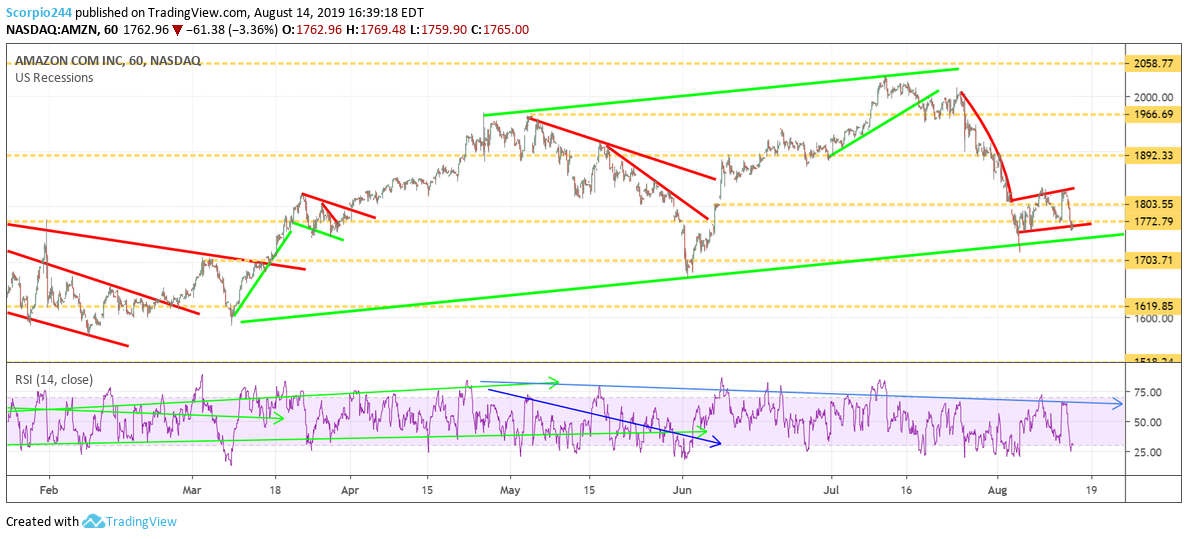
Amazon (NASDAQ:AMZN)
Amazon (NASDAQ:AMZN) better hold on to support around $1770; otherwise, $1700 is coming.
Apple (NASDAQ:AAPL)
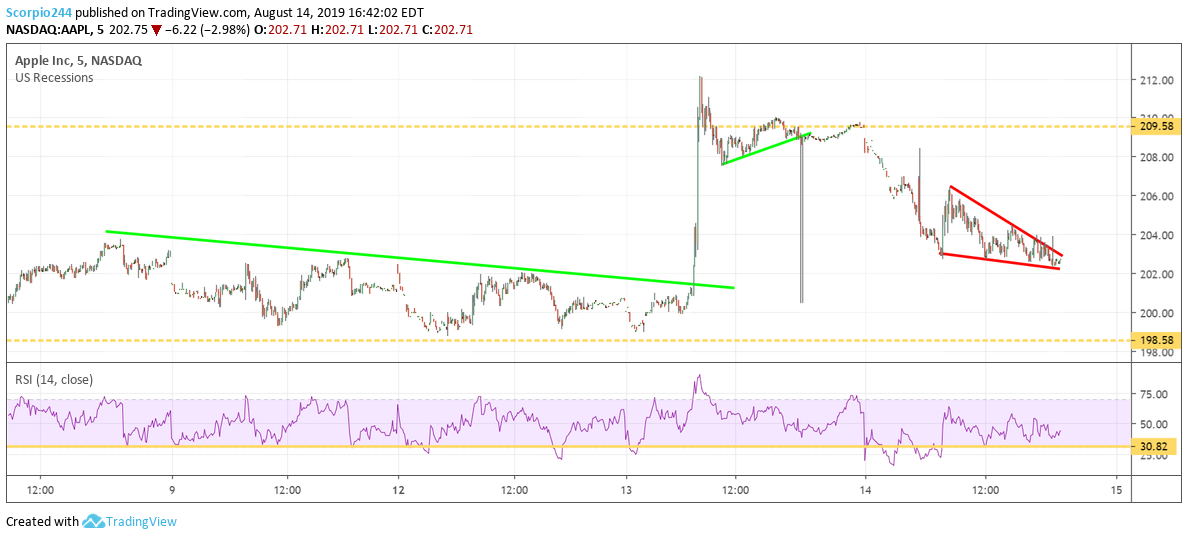
Apple (NASDAQ:AAPL) may still have some further to fall, maybe to around $198.
