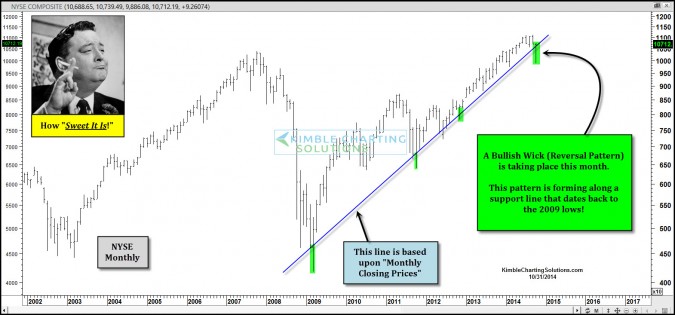
Massive Bullish Wick At 5-Year Support

Published 10/31/2014, 11:25 AM
Updated 07/09/2023, 06:31 AM
US500
-
RTYH25
-
XIV
-

The NYSE

Bullish wicks/reversal patterns are usually good for any asset. When a wick takes place at a key support line, it is often even a better sign.

The above monthly chart of the NYSE highlights that a large bullish wick at key support drawn off the lowest monthly closing price in 2009 is taking place. This wick is almost as large as the one created at the lows back in March of 2009!

The Power of the Pattern shared on Oct the 14th (day before the low) that a rally in Russell 2000 was due and this could be a real positive for small caps and the broad markets. (See post here).

Since the posting, the S&P 500 has made more in a couple of weeks than it has made all year and the Russell has done even better than the broad markets! 

This chart discusses "monthly bullish wicks" check out these huge "daily reversal wicks" that took place on Oct the 15th (in stocks & bonds), this is where the whole rally got started! (see post here).

How did Premium Members take advantage of these reversal patterns? On the morning of October the 15, XIV was purchased as it was hitting rising support and was on its 50% Fibonacci support line and few liked this trade (76% were against the idea)!

In the 11 days following the purchase, VelocityShares Daily Inverse VIX (NASDAQ:XIV) is up over 30%, making nearly as much as the S&P 500 did all of last year. 

Three reasons why stocks could mint a shiny 4th quarter (see here).

Latest comments

Loading next article…
Risk Disclosure: Trading in financial instruments and/or cryptocurrencies involves high risks including the risk of losing some, or all, of your investment amount, and may not be suitable for all investors. Prices of cryptocurrencies are extremely volatile and may be affected by external factors such as financial, regulatory or political events. Trading on margin increases the financial risks.
Before deciding to trade in financial instrument or cryptocurrencies you should be fully informed of the risks and costs associated with trading the financial markets, carefully consider your investment objectives, level of experience, and risk appetite, and seek professional advice where needed.
Fusion Media would like to remind you that the data contained in this website is not necessarily real-time nor accurate. The data and prices on the website are not necessarily provided by any market or exchange, but may be provided by market makers, and so prices may not be accurate and may differ from the actual price at any given market, meaning prices are indicative and not appropriate for trading purposes. Fusion Media and any provider of the data contained in this website will not accept liability for any loss or damage as a result of your trading, or your reliance on the information contained within this website.
It is prohibited to use, store, reproduce, display, modify, transmit or distribute the data contained in this website without the explicit prior written permission of Fusion Media and/or the data provider. All intellectual property rights are reserved by the providers and/or the exchange providing the data contained in this website.
Fusion Media may be compensated by the advertisers that appear on the website, based on your interaction with the advertisements or advertisers.
© 2007-2025 - Fusion Media Limited. All Rights Reserved.