It is almost inconceivable. Just 10 years ago, you could purchase a 3-year Treasury and sock away a risk-free rate of return of nearly 6%. Right now? A paltry 1.5%.
It follows that, today, one must take enormous chances to generate an income stream up and above the pace of inflation. And that’s only if you believe inflation gauges placing the annual rate in the neighborhood of 2%.
For example, let’s assume an individual purchases a 5-year Treasury for its risk free 2% yield. The year-over-year income might maintain the individual’s purchasing power, if the person’s basket does not involve things like medication, health care, education, child care or rent. Worse yet, if the individual’s portfolio is much like the 5-year Treasury itself, the portfolio’s real rate of return would be 0%.
What if the investor wants a real return far greater than 0%? Well, then, he/she would need to take significant chances with money in riskier assets. Stocks, high yield bonds, REITs, MLPs. Indeed, the pursuit of modest reward would come with a high probability of considerable financial loss.
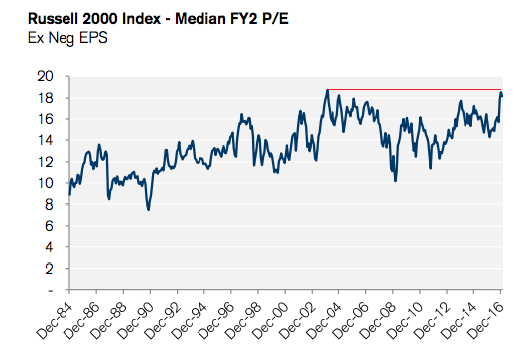
Fundamentally speaking, stocks have rarely been as overvalued as they are here in February of 2017. Forward P/Es for the S&P 500 and the Russell 2000 are already competing with 2000’s tech bubble.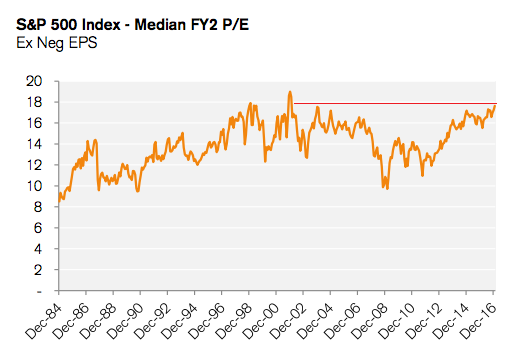
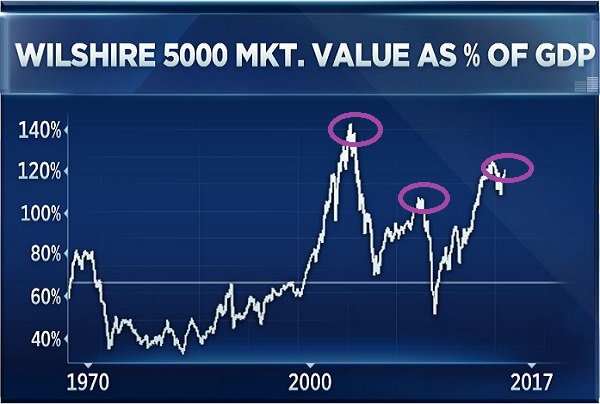
The Buffett Indicator
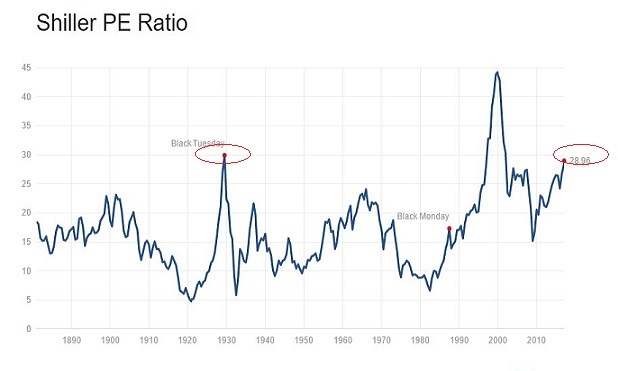
Other metrics, including market-cap to GDP (a.k.a. “Warren Buffett Indicator”) are flashing black, blue and purple. And Shiller’s P/E? Other than 2000, you’d have to go back to 1929’s infamous crash to uncover cyclical price-to-earnings ratios (PE10) that screamed louder.
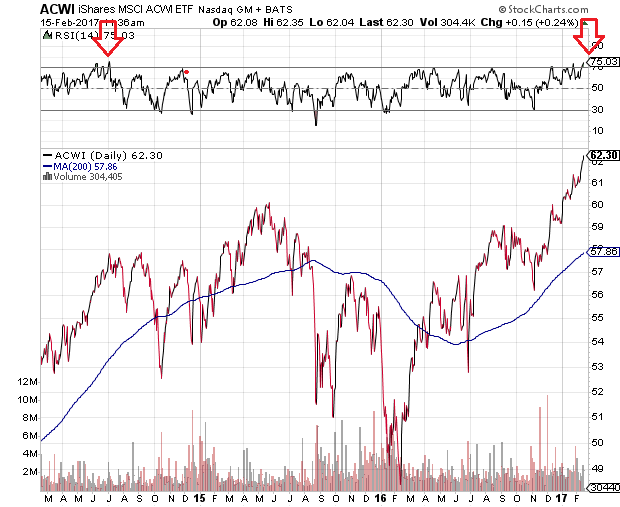
So you do not believe in traditional fundamentals? Fair enough. Of course, even amateur technical analysts are taking notice of the fact that the MSCI All World Index via iShares MSCI ACWI ETF (NASDAQ:ACWI) is more overbought than at any moment since July of 2014. Back then, after reaching similar extremes in the Relative Strength Index (RSI), global stock assets toiled for nine months before recovering.
Perhaps ironically, it is not just stocks that present difficulties for investors going forward. Consider the increasingly risky world of high yield bonds. Some investors are increasingly relying on price appreciation and income from ETFs like SPDR Barclay High Yield (NYSE:JNK). That might be a major mistake.
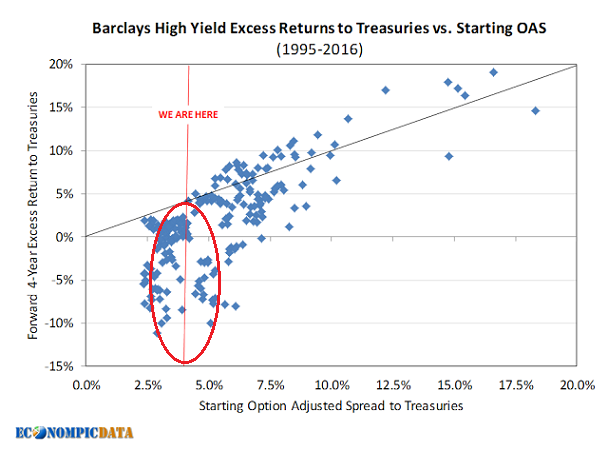
At the moment, the excess yield that an investor is demanding above comparable “risk free” treasuries is around 3.85%. With data going back to 1986, high yield bond investors should only anticipate a forward return that mirrors treasury bond performance with similar duration. Considering the genuine risk of loss in high yield, why would someone prefer the risky road over the risk free route?
Some data, like the data on Option-Adjusted Spreads (OAS) only go back to 1995. Yet, even here, the evidence against adding high-yield bonds to one’s portfolio is powerful. In the chart below, high yield’s upside is best when OAS spreads are much higher than they are currently (3.85%); prospects on 4-year forward excess return over treasuries are relatively dismal when OAS spreads are as low as they are today. (See red oval in chart below.)
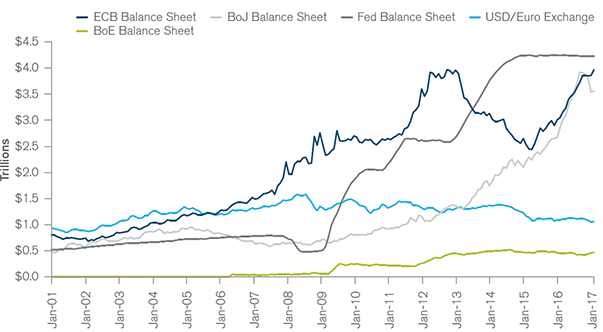
Still, the riskiest of financial assets continue hitting high after record-breaking high. Perhaps Bill Gross at Janus, former bond king at PIMCO, has the answer. He recently explained that a 10-year yield at 2.45% is somewhat anchored. Why? In essence, as long as the European Central Bank (ECB) and the Bank of Japan (BOJ) collectively purchase $150 billions of their own low yielding bonds every month – 0.10% on JGBs and 0.45% on German Bunds respectively – money then flows into the more attractive 10-Year U.S. Treasury yields. Ergo, key borrowing costs tied to the 10-year cannot move up to levels that might trigger a U.S. recession. (Note: Gross marks a 10-year yield at 3.5% as enough for the U.S. economy to shift into recession.)
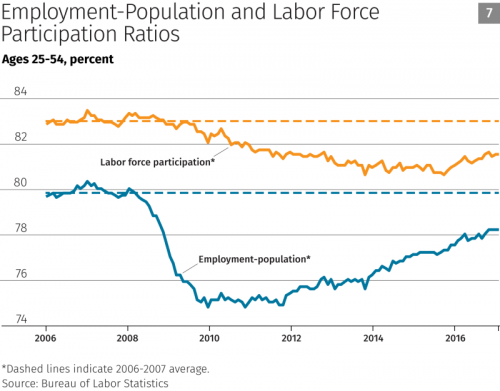
The 'Gross assessment' may not be that far off. As much as Yellen may jawbone the idea that three Fed rate hikes in 2017 will materialize, in spite of under-delivering tightening pledges in every year since the end of the Great Recession, some influential Fed participants are in no hurry to do any rate hikes. Minneapolis Fed Chairman Neel Kashkari highlights the labor slack that is evident in prime working age adults (25-54). Kashkari notes that the labor force participation and employment-population ratios, while showing improvement, have yet to come close to the levels seen prior to the Great Recession.
The way things stand, then, risk asset bulls in stocks and junkier bonds see little chance of borrowing costs tightening meaningfully. Moreover, they regard Trump tax cuts and deregulation as monumental positives, while disregarding uncertainty in trade protectionism or unsustainable debt levels.
For the better part of 2009-2014, a widely diversified mix of 70% growth/30% income proved beneficial for the majority of my growth-and-income clients. Since the Fed’s last asset purchase settled on December 18, 2014, however, I had downshifted to 50%-55% high quality growth, 25% investment grade income and a (20%-25%) bucket of ultra-low yielding cash. The tactical asset allocation shift worked particularly well in 2015 as well as for the first 10 months of 2016; we largely sidestepped the bulk of two harrowing market pullbacks.
Since the election of Trump, however, riskier assets have skyrocketed. A shift back to to our target for moderates (70%/30%) at election time could have captured more of the subsequent 9%-10% S&P 500 price appreciation.
Nevertheless, being “wrong” about how much longer risky assets will climb does not alter the poor risk-reward prospects for chasing those overvalued risky assets. I share similar thoughts to those of Lowe’s CEO (NYSE:LOW) James Tisch. He recently expressed the following on his February 2017 earnings call:
…here is what I’m seeing in the markets today. In the credit markets, spreads on the high yield securities are approaching historically tight levels, while key credit metrics such as leverage and coverage ratios are showing signs of weakening. The leverage loan market has been overrun by such massive inflows of capital that you could probably get a loan to buy a fleet of zeppelins at this point in time… the S&P 500 is trading 3 turns higher than the 50-year average of 2016. These valuations make me uncomfortable, especially given the unknowns in taxation, foreign trade, regulation and more… To sum up, the markets are priced for perfection, and they have been that way for quite some time, complacency reigns supreme. However, my experience has shown me that this state of affairs won’t go on indefinitely.
My guidance? Tread lightly. Markets that are priced for perfection rarely get what they have priced in.
