
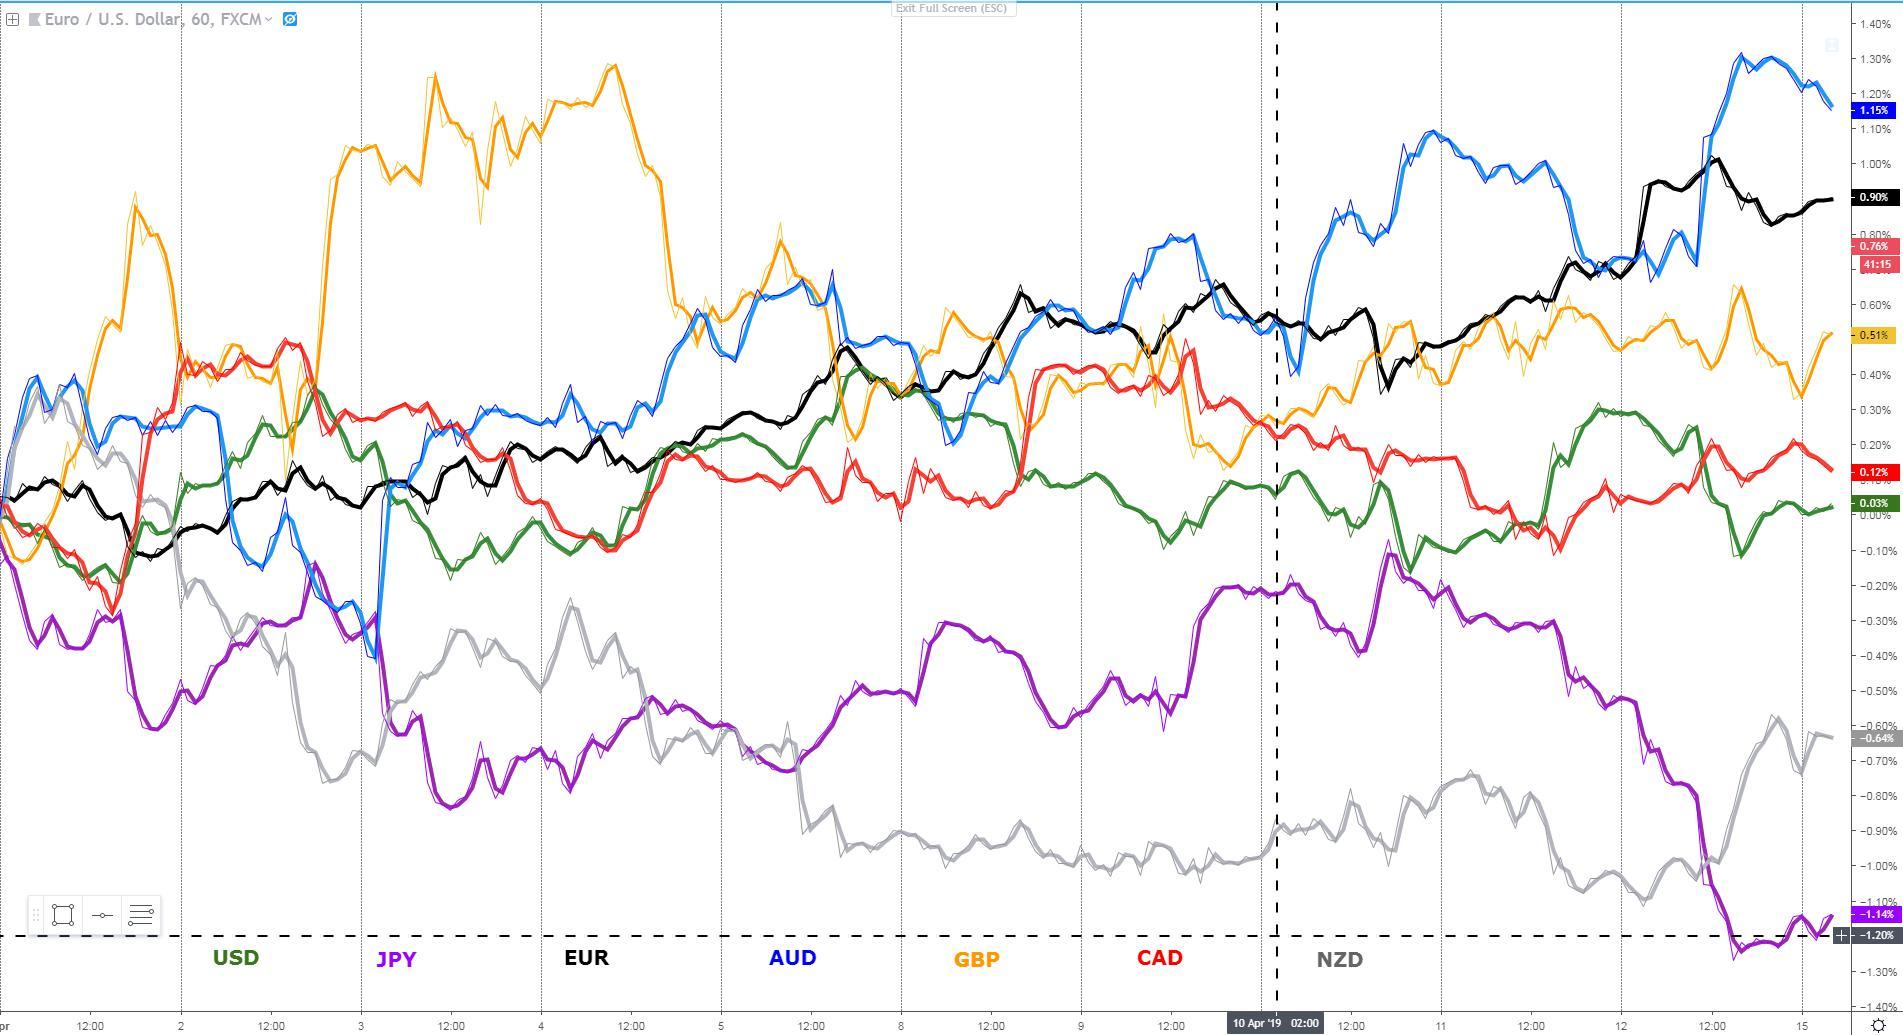
Market participants are certainly blaring the trumpets as a whole legion of newly found buyers go full throttle buying risk-related assets in response to the upbeat Chinese economic figures in trade (mainly exports) and credit growth, which implies better reads should lie ahead. The massive rally in the AUD/JPY portrays like no other pair the ebullient mood in financial markets, as both global equities and bond yields move up in tandem in what should be understood as a reflection of renewed optimism towards a global recovery. The fuel engineering this rebound is thrown by China alone, but let's not forget, it accounted for half the global growth since the GFC. The euro, as highlighted in my last report, is another currency defying gravity by putting on its best performing month YTD, capitalizing on the rather neutral outlook by the USD this month. The outlook for EM should definitely improve from here on out, which retro-feeds in a bullish AUD as a proxy to play CNY longs, while at the same time, it suggests the recent pattern of foreign-invested USD repatriation may see a turnaround with negative USD implications as more capital gets interested in the EM growth story if China keeps it up. The Kiwi has also been spurred by its correlation dynamics with the AUD, while CAD, GBP were the two most uneventful pairs in terms of daily movements.
Narrative In Financial Markets
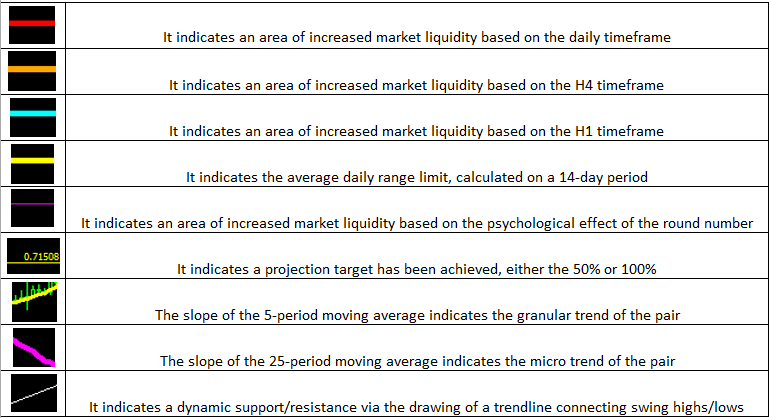
- The resurgence of positive data out of China is at the forefront of the latest rampage movements in risk assets as trade (mainly boost in exports while concerns on import figures remain) and credit figures (massive jump in aggregate financing) in China are celebrated.
- Even if the US consumer confidence came downbeat on Friday, by the time the release came out, ‘true risk on’ dynamics were in full swing, hence it was largely ignored.
- In the US, the S&P 500 closed above the 2,900.00 for the first time in over half a year with US financials the top performer sector spurred by JPM results.
- The Japanese yen was absolutely annihilated on Friday, as the news out of China’s economic figures came combined with US Treasury Secretary Mnuchin signaling further progress in the trade talks by highlighting that a commitment of enforcement could work both ways.
- US President Trump kept attacking the Fed via Twitter, noting that “if the Fed had done its job properly, which it has not, the Stock Market would have been up 5 to 10k additional points”, adding that “QT was a killer, should have done the exact opposite.”
- As part of the G20 Finance Ministers and Central Bankers, it was a non-event for financial markets, with the group acknowledging that the global economy faces evident risks despite the usual ‘overinflated’ optimism was emphasized by talking up hopes of a bounce in 2020.
- ECB President Draghi showed signs of concern about the Fed’s independence, arguing that “if the Central Bank is not independent then people may thin monetary policy is determined by political advice rather than objective assessment of the economic outlook.”
Recent Economic Indicators & Events Ahead
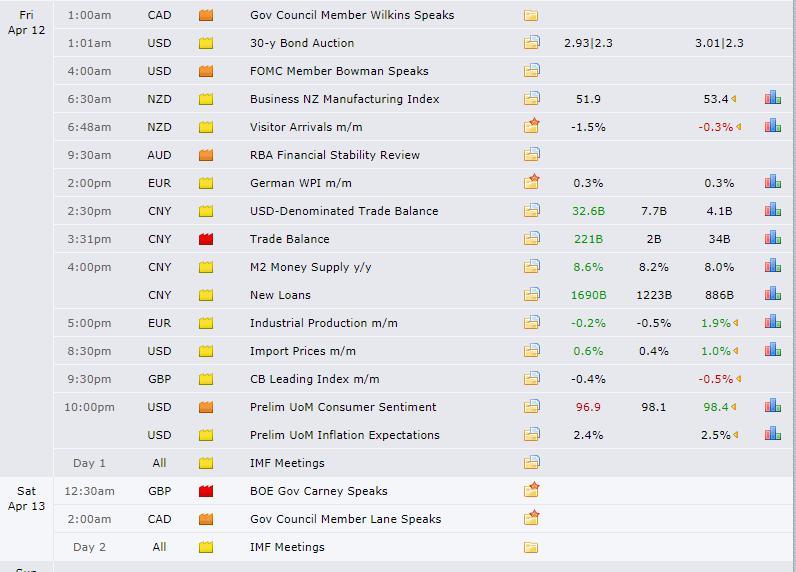
Source: Forexfactory
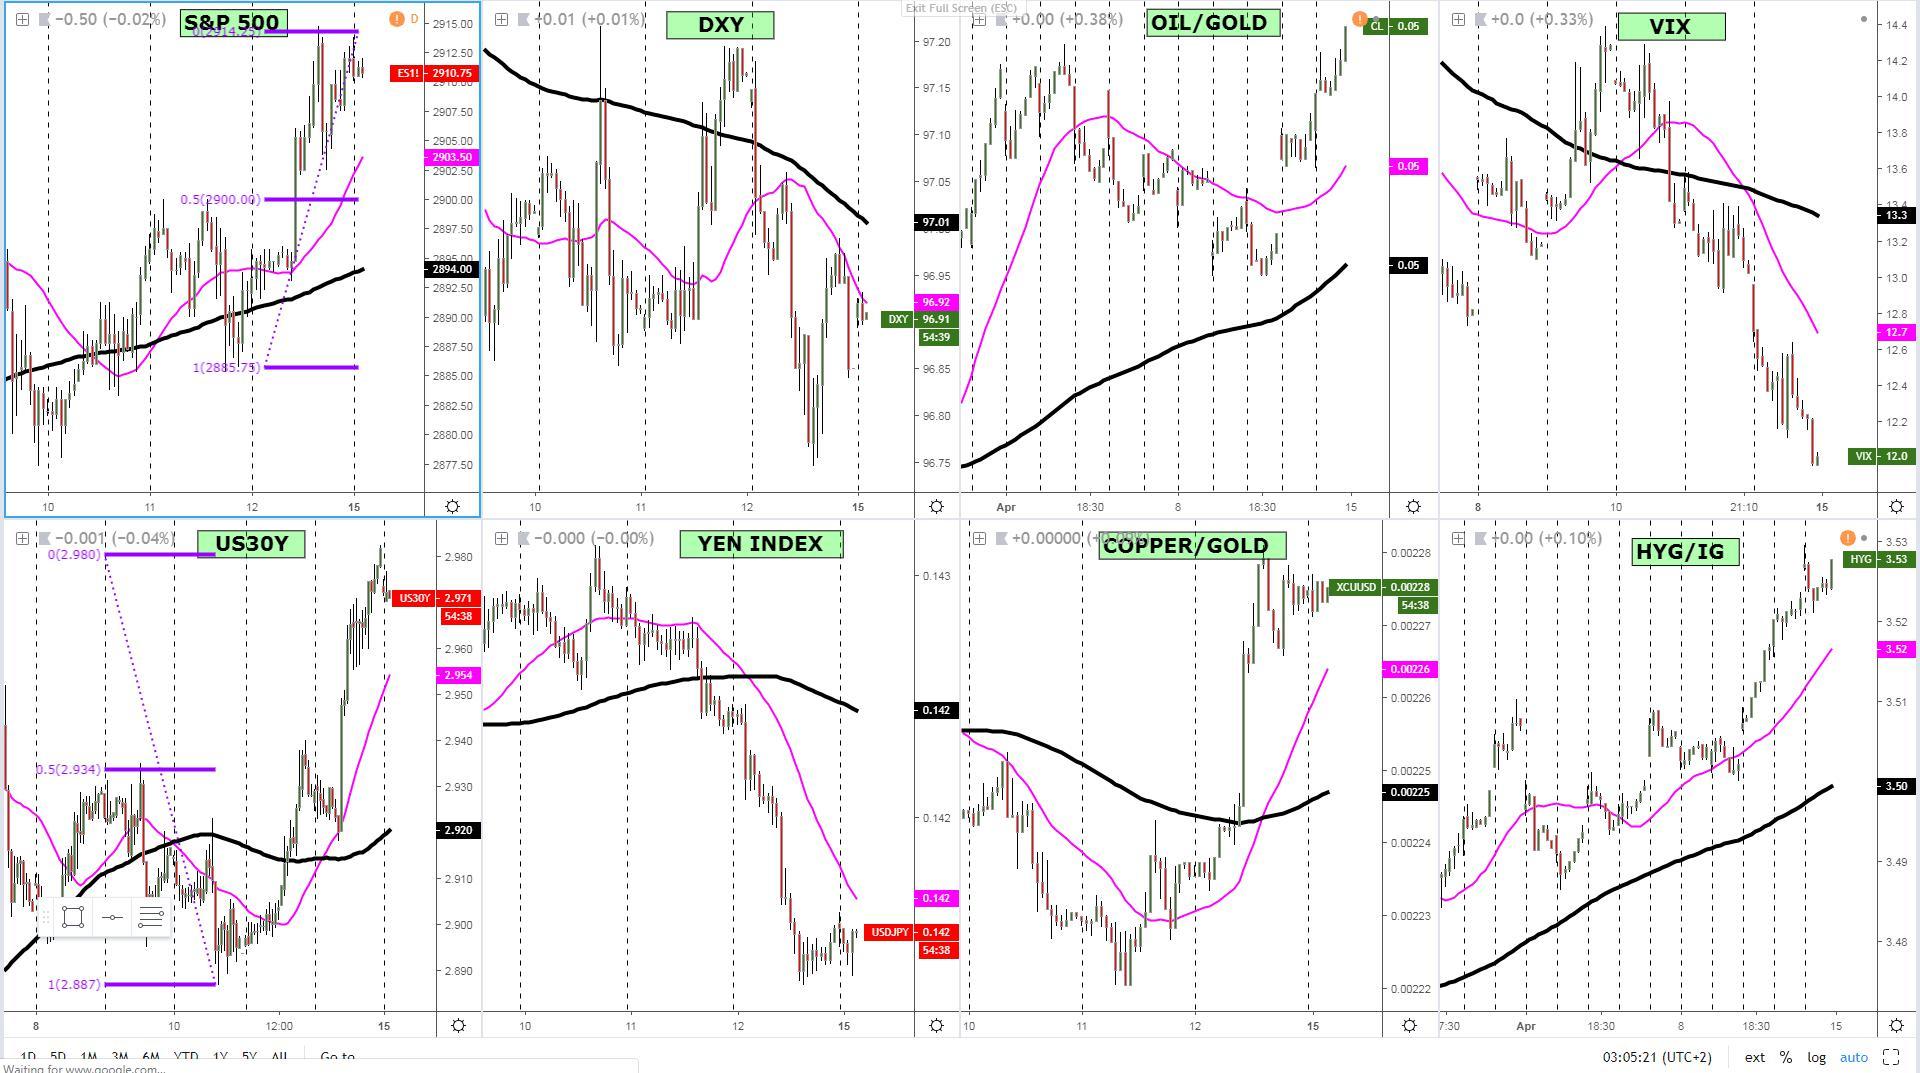
RORO (Risk On, Risk Off Conditions)
As the charts below illustrate, we’ve entered a period of absolute dominance by micro ‘true risk on’ flows, with all charts without exceptions flashing risk appetite is well and truly alive. Note, the moves from Friday, as portrayed by the major selloff in the Japanese yen, should be a reminder that unless you are a momentum trader looking to trap weak-handed players for quick intraday trades, the overstretched nature of the movements suggest it becomes riskier to play the upside without some type of pullback, even if it occurs in a shallow fashion. The S&P 500 has hit its 100% proj target as has the US 30-year bond yield spread, therefore outlines the risks of a technical correction.
Latest Key Technical Developments In G8 FX
Interested about downloading today's key levels? Find the MT4 templates, updated daily, by clicking the following link.
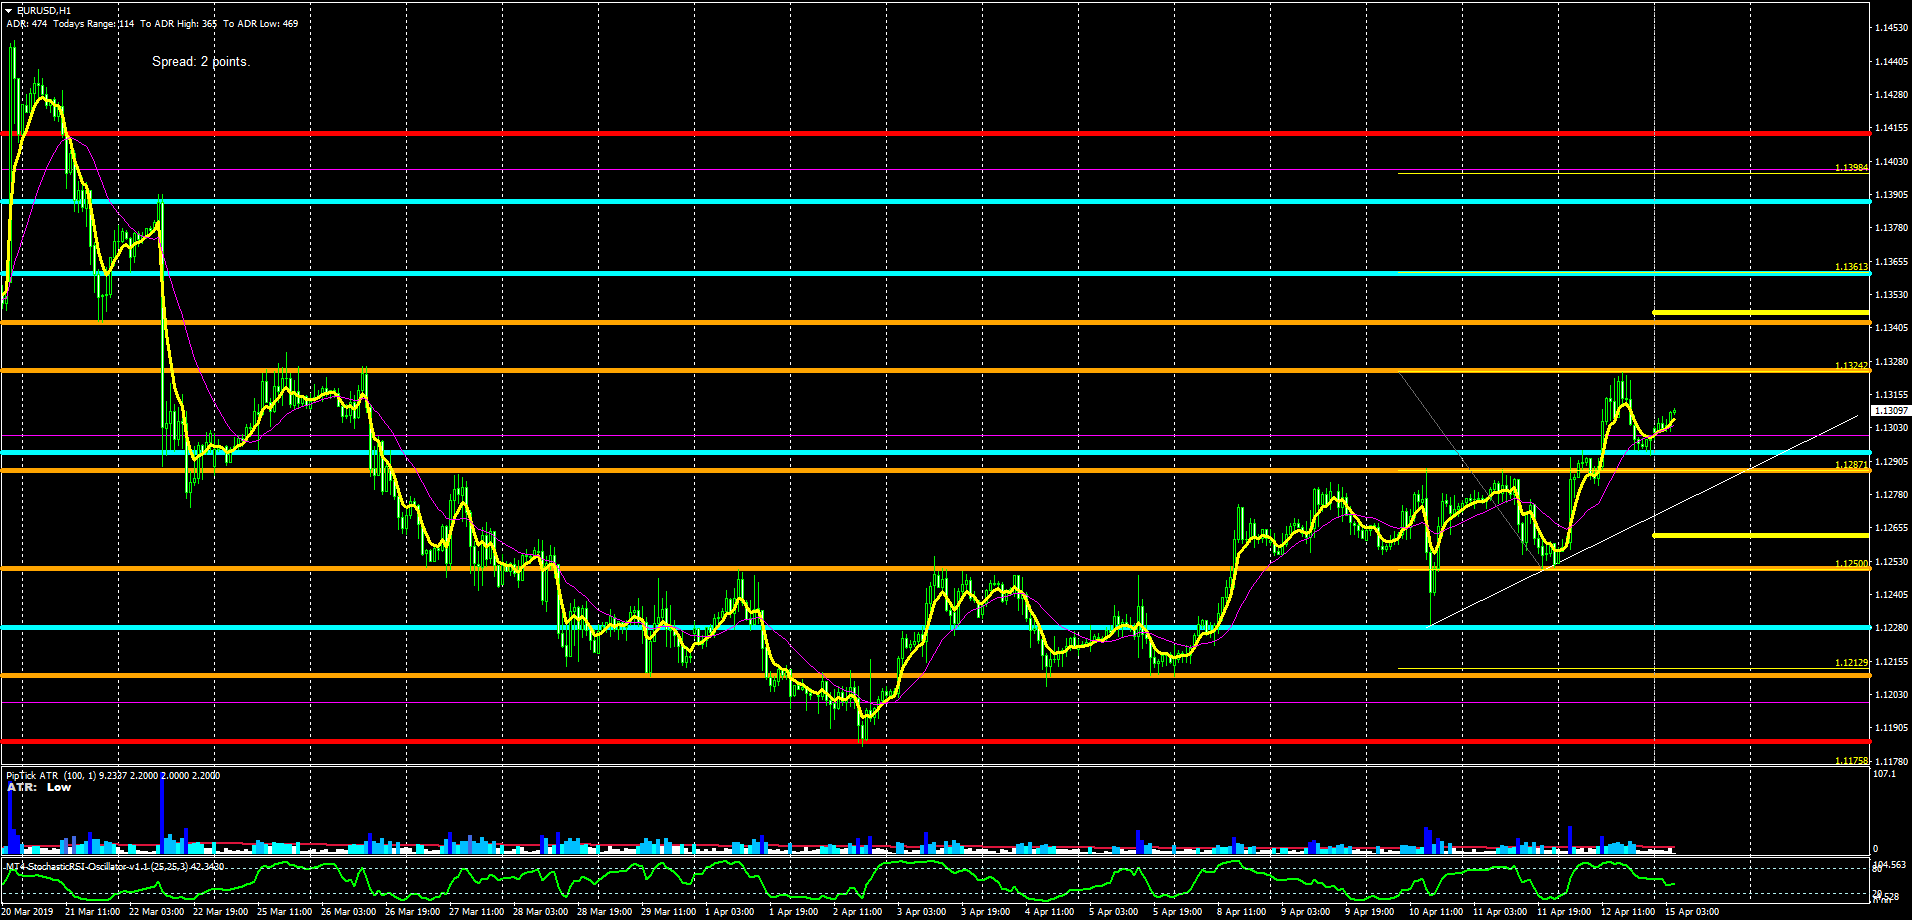
EUR/USD: Pullback After 100% Proj Target Hit
With USD repatriation flows likely in reversal mode as China’s data strengthens the outlook towards EM economies, alongside risk appetite adding additional downside pressure to the USD, the euro continues to find a better bidding tone. In this type of environment, and with technicals unambiguously positive as the 25HMA bullish slope reflects even as a pullback sub 1.13 took effect, the main bias remains to play longs for an extension of the recent gains. A break below the 1.1285-90 H4 horizontal line would be a first warning of the flows in the exchange rate shifting for potential damage of the uptrend, even if it won’t be until a breach of the ascending trendline off April 10th that buyers should really start questioning the underlying bias. The current bullish structure is one anchored by renewed impetus in its cycle dynamics, with the latest ramp up in the rate achieving a greater appreciation than any of the previous leg ups since the April bottom. This is not the type of market communicating that the bullish cycle is running out of steam anytime soon.
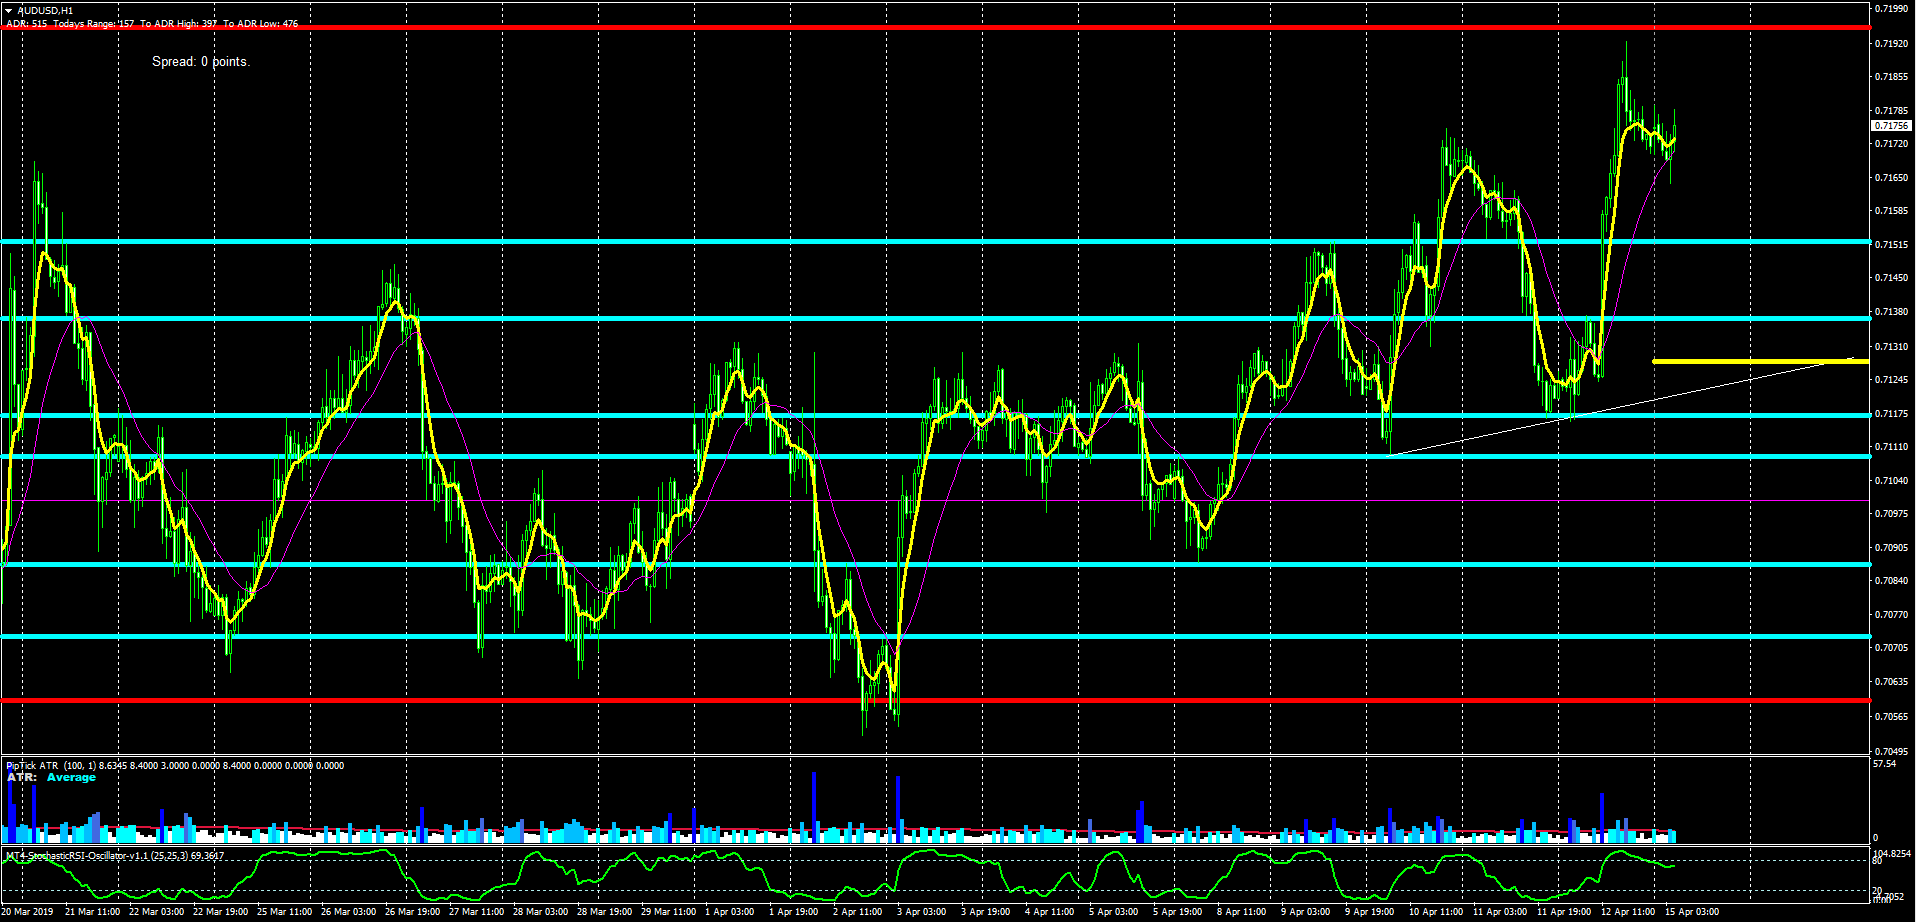
AUD/USD: Demand Found On Shallow Pullbacks
On the back of one of the most aggressive intraday demand imbalances in 2019 in a context of low vol in this exchange rate, you would expect buyers to continue pilling up, at least aiming for a potential level where a change of behavior may take effect above 0.72. That’s an area where existing longs would find plenty of liquidity to potentially close long-help positions. Should the 0.72 area be broken, it will most likely be driven by persisting USD weakness with a possible absence of stocks-derived flows as the S&P 500 looks overstretched at these levels. At this stage, I refuse to envision a spontaneous reversal of the dominant bullish trend after seeing the overwhelming demand imbalance that took place last Friday, one that should lead at least the filling out of offers thru 72c.
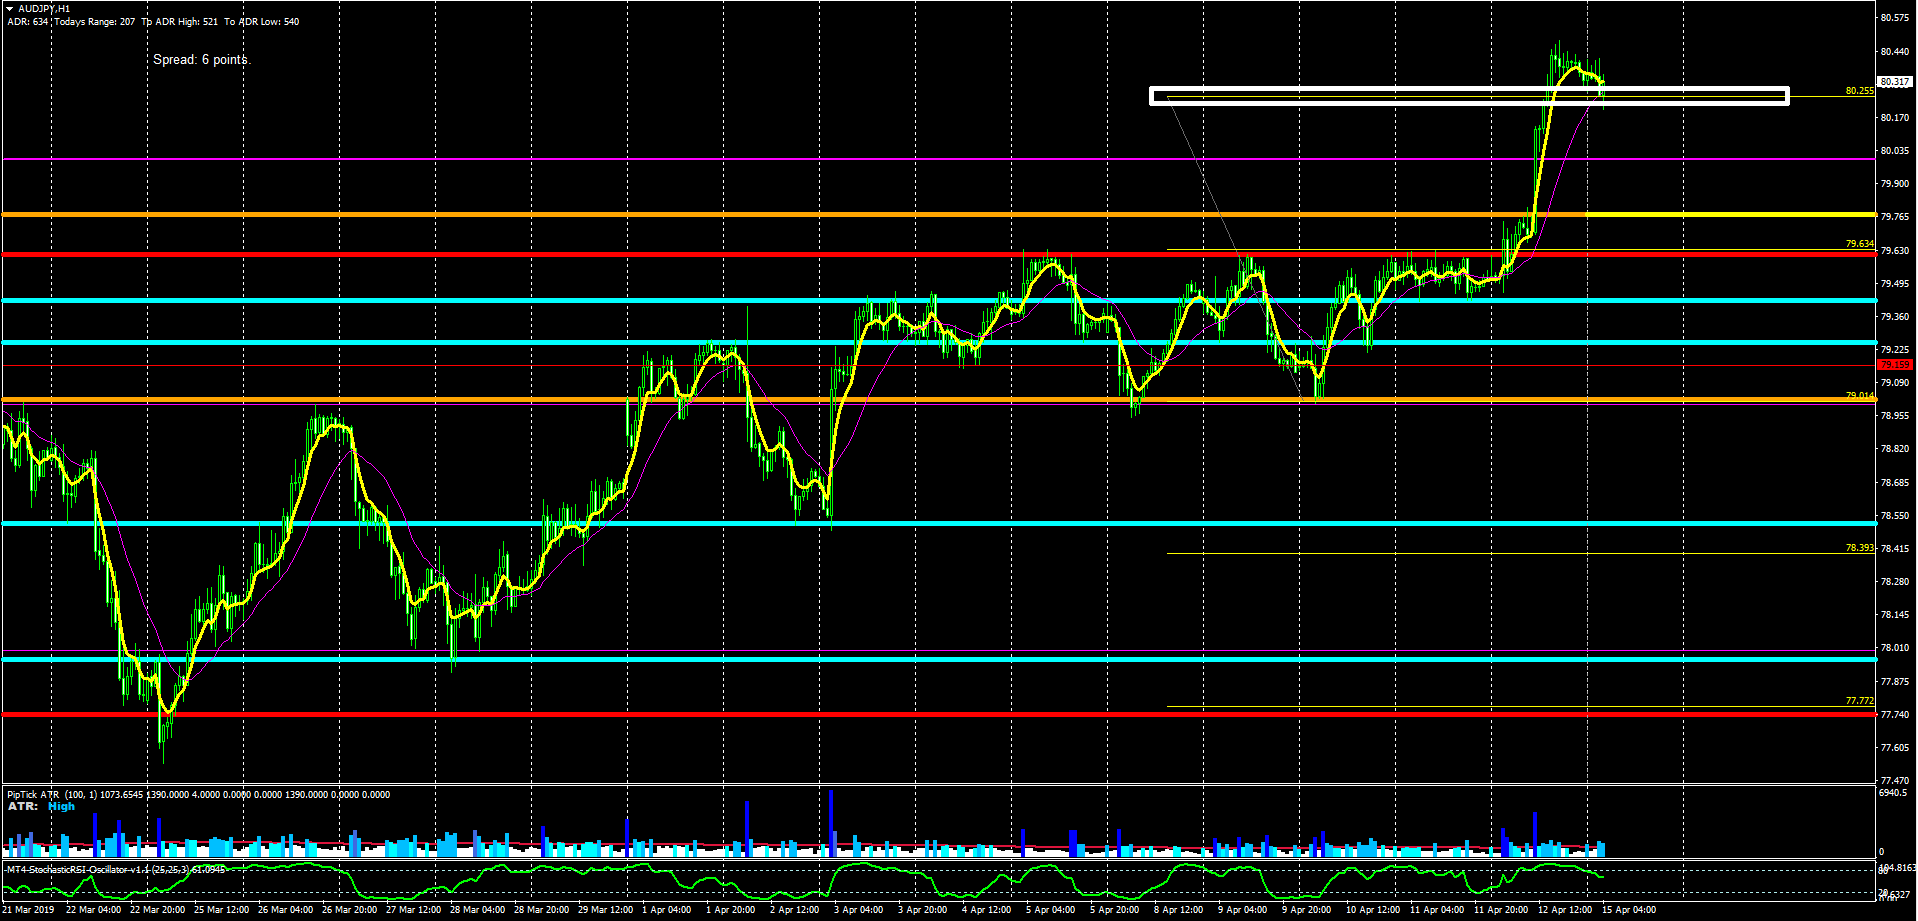
AUD/JPY: On A Tear As True Proxy Of Ebullient Sentiment
Without a doubt, long AUD/JPY on Friday was the best play. One that unraveled away of a congestive range-bound area that had lasted for most of April in a 60-pip range give or take. As positive news out of China’s economic activity hit the screens and the range broke out, it was off to the races. The consolidation above the 100% proj target signals a further squeeze of shorts is a possibility that has the technicals as the main backing, with 80.25-20 (proj target violated) now expected to act as a pocket of intraday demand. As a caveat, I don’t see much further upside potential on the 2 intermarket assets that fuel this pair as both the US30y and the SP500 reached key technical projection targets. If 80.20-25 is taken out, expect buyers’ next stronghold circa 80.00 ahead of 79.75, the latter being the origin source of the strong demand seen last Friday at the London open.
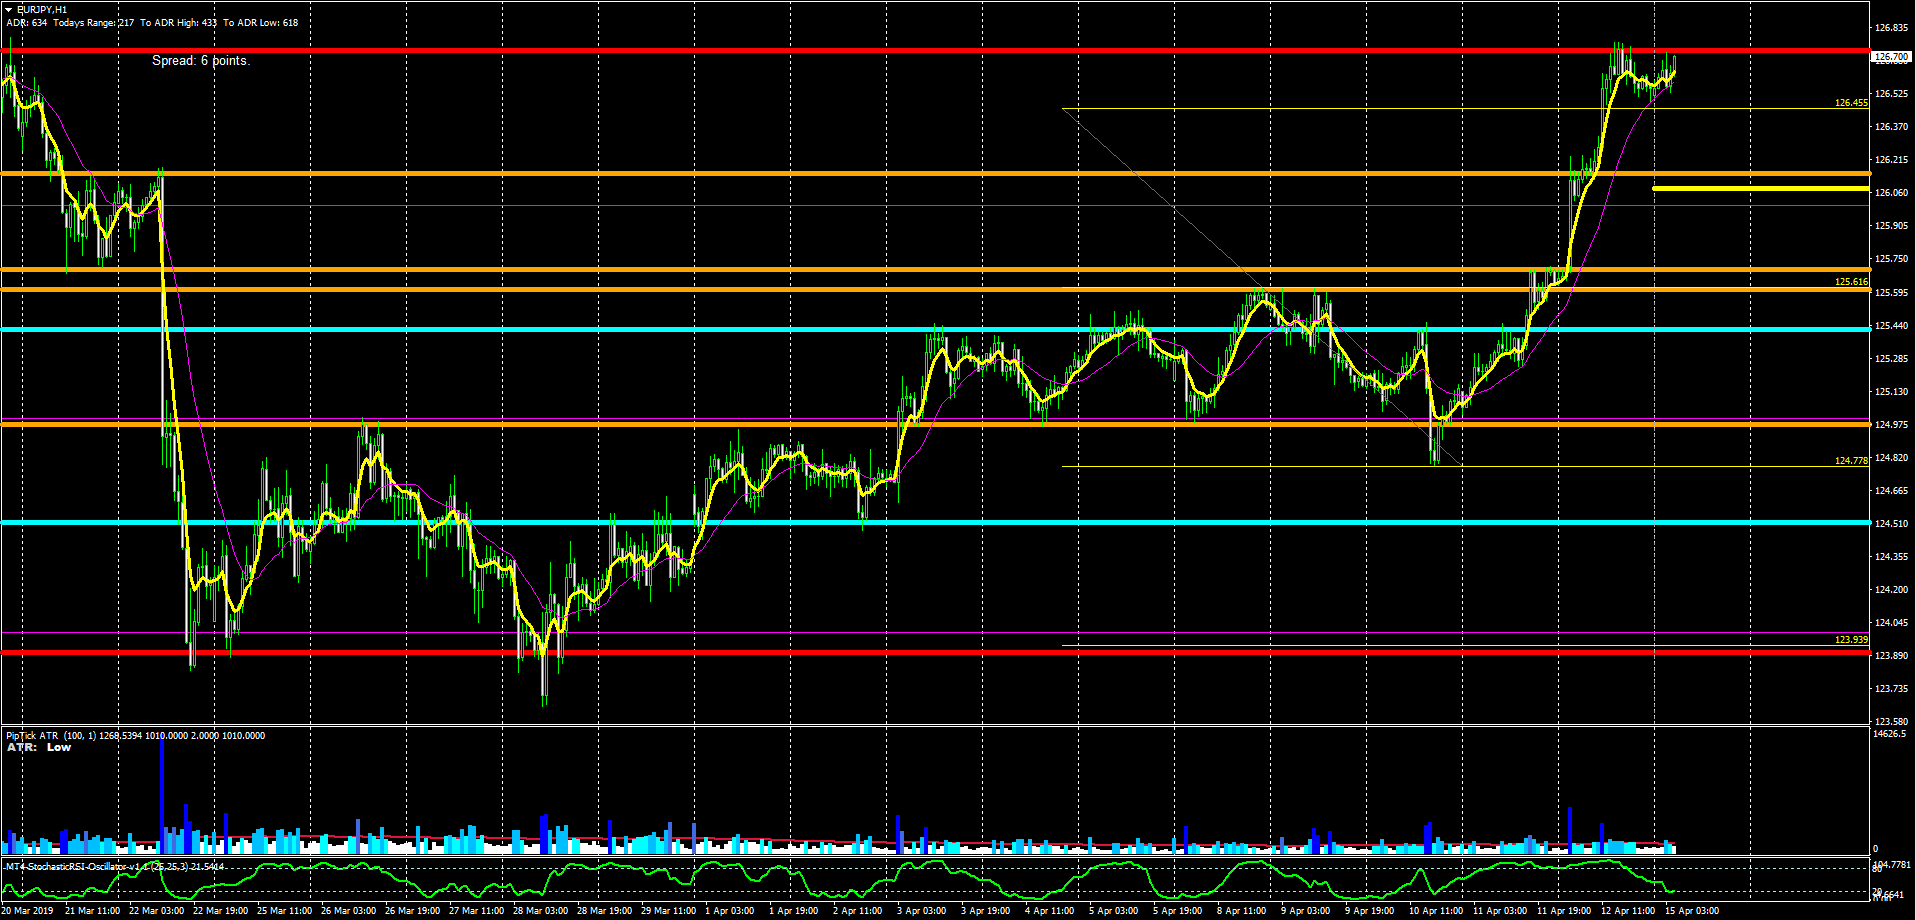
EUR/JPY: Stampede Of Buyers, Daily Resistance Reached
The bull run in the exchange rate, similar to what we’ve seen in the AUD/JPY, is nothing short of spectacular. Proof of that is that the exchange rate cut through the 100% proj target of 126.45 like a hot knife through butter and never looking back up until this point. Which leads me to think that opportunities to keep trapping sellers on the wrong side of the market will continue to be available, perhaps not so much pushed by a continuous ebullient move in the S&P 500 or US30y but more about the demand derived off the EUR/USD, which looks quite bullish to extend its gains. Any push above the daily resistance area currently tested may see 127.00 as the next logical target, even if one should be aware that any levels above 126.75 will represent an excellent opportunity for sellers to take further chips off the table, which may create added supply. It remains to be seen if enough to counterbalance the ongoing demand imbalance as China’s growth prospects brighten up near term.
Important Footnotes
- Risk model: The fact that financial markets have become so intertwined and dynamic makes it essential to stay constantly in tune with market conditions and adapt to new environments. This prop model will assist you to gauge the context that you are trading so that you can significantly reduce the downside risks. To understand the principles applied in the assessment of this model, refer to the tutorial How to Unpack Risk Sentiment Profiles
- Cycles: Markets evolve in cycles followed by a period of distribution and/or accumulation. The weekly cycles are highlighted in red, blue refers to the daily, while the black lines represent the hourly cycles. To understand the principles applied in the assessment of cycles, refer to the tutorial How To Read Market Structures In Forex
- POC: It refers to the point of control. It represents the areas of most interest by trading volume and should act as walls of bids/offers that may result in price reversals. The volume profile analysis tracks trading activity over a specified time period at specified price levels. The study reveals the constant evolution of the market auction process. If you wish to find out more about the importance of the POC, refer to the tutorial How to Read Volume Profile Structures
- Tick Volume: Price updates activity provides great insights into the actual buy or sell-side commitment to be engaged into a specific directional movement. Studies validate that price updates (tick volume) are highly correlated to actual traded volume, with the correlation being very high, when looking at hourly data. If you wish to find out more about the importance tick volume, refer to the tutorial on Why Is Tick Volume Important To Monitor?
- Horizontal Support/Resistance: Unlike levels of dynamic support or resistance or more subjective measurements such as fibonacci retracements, pivot points, trendlines, or other forms of reactive areas, the horizontal lines of support and resistance are universal concepts used by the majority of market participants. It, therefore, makes the areas the most widely followed and relevant to monitor. The Ultimate Guide To Identify Areas Of High Interest In Any Market
- Trendlines: Besides the horizontal lines, trendlines are helpful as a visual representation of the trend. The trendlines are drawn respecting a series of rules that determine the validation of a new cycle being created. Therefore, these trendline drawn in the chart hinge to a certain interpretation of market structures.
- Correlations: Each forex pair has a series of highly correlated assets to assess valuations. This type of study is called inter-market analysis and it involves scoping out anomalies in the ever-evolving global interconnectivity between equities, bonds, currencies, and commodities. If you would like to understand more about this concept, refer to the tutorial How Divergence In Correlated Assets Can Help You Add An Edge.
- Fundamentals: It’s important to highlight that the daily market outlook provided in this report is subject to the impact of the fundamental news. Any unexpected news may cause the price to behave erratically in the short term.
- Projection Targets: The usefulness of the 100% projection resides in the symmetry and harmonic relationships of market cycles. By drawing a 100% projection, you can anticipate the area in the chart where some type of pause and potential reversals in price is likely to occur, due to 1. The side in control of the cycle takes profits 2. Counter-trend positions are added by contrarian players 3. These are price points where limit orders are set by market-makers. You can find out more by reading the tutorial on The Magical 100% Fibonacci Projection