Forex News and Events
”Goldilock NFP Report“, really?
After a harsh winter and port strike among other temporary factors that have caused the US economy to almost stagnate in the first quarter (Q1 GDP grew by only 0.2%q/q), persuading definitely the Fed to delay the first rate hike, traders are waiting on the first good news to resume the dollar rally. Unfortunately, April’s data were disappointing as well, non-farm payrolls came in at 223k versus 228k while previous read was revised down to 85k (!) from 126k. Surprisingly, most analysts called it a “good” news, arguing that the slowdown was indeed temporary and that the figures will support expectations that the Fed is on track to raise interest rates. However, traders didn’t buy it, EUR/USD is moving sideways since then; the dollar even lost ground against 9 of the G10 currencies. Faking good news is not good enough, markets want to see real improvements.
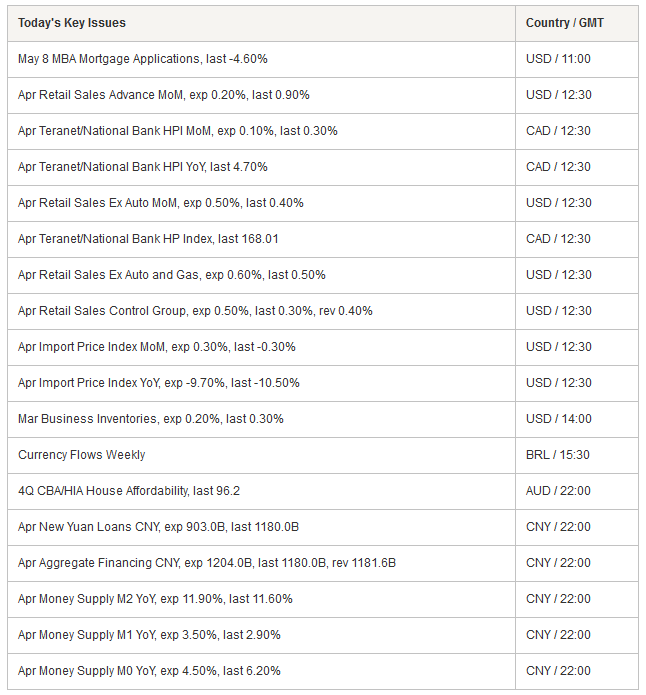
We still expect the US economy to recover slowly with a significant acceleration in Q3, pulling the dollar up. In the short/mid-term, traders are very impatient to play the upcoming dollar rally. Therefore, the release of several “real” good news in a row will resume the USD appreciation. The release of US economic data continues this afternoon with April retail sales and MBA mortgage applications data, April PPI and initial jobless claims reads are due tomorrow while industrial production, empire manufacturing index and Michigan sentiment will be released on Friday.
Japan’s debt is still not too big to fail
Japan has over the past year increased the sales tax from 5% to 8% in an effort to control debt which has a stratospheric ratio debt/GDP –the biggest in the world - of 227.2%. Late April, Japan failed to increase again sales tax and has been downgraded by Fitch, the rating agency, to A from A+ over what we decently called debt fears. Let’s add that Bank of Japan Governor Kuroda admitted the impact of increasing consumptions taxes had a negative effect on the overall economy directly damaging the household purchasing power. However, we anticipate the BoJ will further increase VAT to push inflationary expectations despite harmful consequences in the Japanese economy. There is really not many options now for the BoJ than to play more on fiscal arrow of the Abenomics policy.
Statistically speaking, Japan’s Q1 GDP grew moderately by 1.6% while inflation target has been set at 2%. Today, Balance of Payments came in better than expected, Yen 2.8 trillion vs Yen 2.0 trillion. Japan’s current account surplus is now at the highest in 7 years. The country surplus currently benefits from low crude oil prices pushing down the imports and a very low JPY level spurred the foreign exports. After Fukushima disaster in 2011, Japan relied more on energy imports as nuclear reactors were systematically shut down. So a lower oil prices has worked out well of balance of payments so far. Clearly, PM Abe’s strategy of deliberately debasing the Yen has worked out well for Japan by pilfering export growth. We anticipate, Nikkei is likely to further benefit from this export driven surplus and maintain equity at a decent level as Japan’s concern over deflation is far from being finished.
USD/JPY is trading between 119.00 and 120.50. It is likely that a resistance at 120.50 to be targeted.
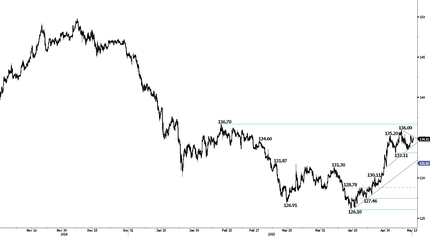
EUR/JPY - Further consolidation with triangle


The Risk Today
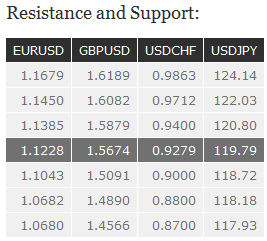
EUR/USD has broken the support found at 1.1334 and 1.1287 confirming persistent selling pressures. Hourly supports can be found at 1.1131 (11/05/2015 low ) and 1.067 (30/04/2015 low). Hourly resistance now stands at 1.1250 (12/02/2015 high). In the longer term, the symmetrical triangle from 2010-2014 favors further weakness towards parity. As a result, we view the recent sideways moves as a pause in an underlying declining trend. Key supports can be found at 1.0504 (21/03/2003 low) and 1.0000 (psychological support). Break to the upside would suggest a test of resistance at 1.1534 (03/02/2015 reaction high).
GBP/USD has moved above its resistance at 1.5490 (29/04/2015 high) and 1.5619 (200d MA). Next resistances can be found at 1.5826 (27/11/2014 reaction high). Hourly support lies can be located at 1.5663 (intraday low) and 1.5552 (05/012/2015 low and 26/02/2015 old resistance). In the longer term, the technical structure looks like a recovery bottom whose maximum upside potential is given by the strong resistance at 1.6189 (Fino 61% entrancement). The current upwards consolidation suggests a medium-term persistent buying interest as long as support as 1.5380 holds.
USD/JPY remains weak as long as prices remain below the key resistance at 120.10/20 (declining trendline). Hourly support stands at 119.20 (29/04/2015 high and intraday low) then 118.53. Another resistance is given by the recent high at 120.50 then 120.84 (13/04/2015 high). A long-term bullish bias is favored as long as the strong support at 115.57 (16/12/2014 low) holds. A gradual rise towards the major resistance at 124.14 (22/06/2007 high) is favored. A key support can be found at 118.18 (16/02/2015 low), whereas a key resistance stands at 121.85 (see also the long-term declining channel).
USD/CHF has pulled back after the break of the resistance at 0.9413 (30/04/2015 high). Lower support can be located at 0.9215 (12/05/2015 low) and 0.9073 (07/05/2015 low). Another resistance can be seen at 0.9414 (05/05/2015 high). In the long-term, there is no sign to suggest the end of the current downtrend. After failure to break above 0.9448 and reinstate bullish trend. As a result, the current weakness is seen as a counter-trend move. Key support can be found 0.8986 (30/01/2015 low).

