I had a number of people email requesting what I have been up to (did I die, am I ill) so here it is...
Back in April 2016, after being a part of TreasureChests for 13 years I decided to hang up my pen and pursue other things. As many know or do not know, TreasureChests is shutting the doors at the end of this month. It was a pleasure working with Captain Hook and we still keep in contact on a regular basis to discuss what is going on with the stock markets. Since I have been busy the past year with a side project that is morphing into something bigger, I miss not writing…so here is an update.
Life is a journey and in order to grow and evolve, people must continue to learn and put themselves in new situations. The broad stock markets of the US have failed to correct and the chiral Inversion of the Contracting Fibonacci Spiral I wrote about, it appears that things will climb higher into 2018, 2019 and 2020 before peaking. With this in mind, there is a chance for making money…or getting money for a company if the idea is properly presented. The following technical blurb describes why there is a limited window to move for starting accompany, so please bear through this to understand…I originally had an article titled “The Contracting Fibonacci Spiral” published in the April 2013 issue of Technical Analysis of Stocks and Commodities, but failure to move lower that year indicated it had a Chiral Inversion (http://www.safehaven.com/article/31530/chirality-and-chiral-inversions-in-stock-market-cycles ). Seeing how the stock markets are behaving at present, this crazy idea seems to be firming up…it remains a hypothesis and only time will show how it truly evolves to its point of singularity. Based upon the pattern, lows should be established around mid 2018 and 2019, with the final big top in 2020. Play accordingly, knowing that between 2020 and 2024, things will be extremely rough financially. For anyone who has not read about the Contracting Fibonacci Article or the Chiral Inversion it transformed into, I would highly recommend reading about it…I took a lot of flack for it back then and only now after I revisited it recently, it is essentially behaving as expected which made me realize that a narrow window exists to try and start a company.
Last summer out at the lake over a few glasses of wine, I pursued deeper into a niche biotech market that has taken the wrong molecular design, drug delivery, formulation, marketing and logistics planning over the past number of decades and decided to start a biotech company. My entire education is science based (BScH and MSc) so learning anything new in this area just requires the learning curve. The further one goes down the rabbit hole, the stranger things become and the greater some problems become realized, especially when crafting patents.
Since this revelation, three other cofounders were found and now we are in the process of completing our Prospectus, development of the long-term business plan and of course, developing a web site. I will not reveal the name of itat this point in time due to staging, but I can state that it will be extremely disruptive to large cap companies in the space we will be entering. The knowledge of the stock market I gained over the 13 years at Treasurechests really aided in becoming CEO/CSO of our company that will provide understanding of when to raise capital and how to ride the wave of psychology. I want everyone to realize that acquired talents learned yesterday and today can be applied tomorrow in ways one never would have dreamed of.
Stock Market Direction

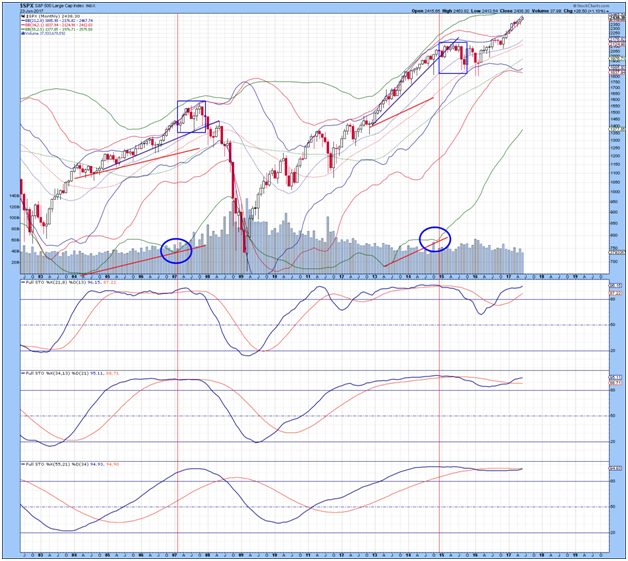
How can I not at least put up one chart to clarify where things are headed for the S&P 500 Index? Above is the monthly chart of the S&P 500 Index. Back in 2006, I wrote an article titled “The Technical Palette” describing the methods of analysis I forged…multiple layering of Bollinger Bands® and their interactions for determining tops, bottoms and oversold/overbought conditions and use of Full stochastics with Fibonacci based settings, 21,8,13, 34,13,21 and 55,21,34 for spreading out the %K and %D lines to improve buy/sell signals. For uptrends, lower 21, 34 and 55 MA Bollinger Bands will curl down in sequence, followed by curling up to ultimately indicate a topping pattern or bottoming pattern. At present, we can see the lower 21 MA Bollinger Band has curled up, while the 34 MA Bollinger Band (BB) is declining. Note that since early 2015, the lower 55 MA BB has been in an uptrend, with no isignof curling down. From empirical analysis, it would take approximately 2.5 to 3 years for the lower 55 MA Bollinger Band to begin curling down and then curl up. Everything has to occur in sequence and since the it has not happened in sequence with the 21 and 34 MA BB’s, these two will again have one more oscillation before the 55 MA BB eventually curls down and then up to indicate a top, likely in early to mid 2020.
Stochastics 1, 2 and 3 in order of decline are seen at the base of the chart, with overextensions in every case. Given the overbought nature of the S&P 500 Index based upon stochastics, Bollinger Bands will play a more critical part of determining when a top is in place. Regarding trying to place an Elliott Wave count on this…refer to Glenn Neely’s analysis as nobody can touch his work.
With low public participation, a record number of bears and a high put/call ratio at present, there is no sign of a top in the stock market yet. Knowing this is knowing that the next few years stand to bode well for those wishing to start companies with a great idea...or invest in the stock market.
Back within 6 months to further discuss tales of the market…
