This week I want to discuss several risks I am currently watching starting to manifest “behind the scenes” so to speak. But first, let’s take a quick review of the markets which currently are flashing some very troubling signs.
Last week, I discussed the ongoing consolidation and struggle as the markets remain “trapped” between downtrend resistance and the crucial support levels of the previous breakout to new highs. The S&P 500 charts below have been updated through Friday afternoon.
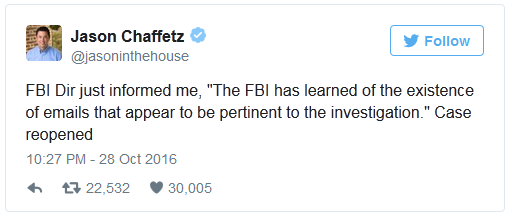
(Note: as I am writing this Jason Chaffetz just confirmed the FBI was reopening the investigation into Hillary Clinton’s emails based on new evidence. This has caused the market to panic a bit and the battle to hold support is being waged as I write this.)
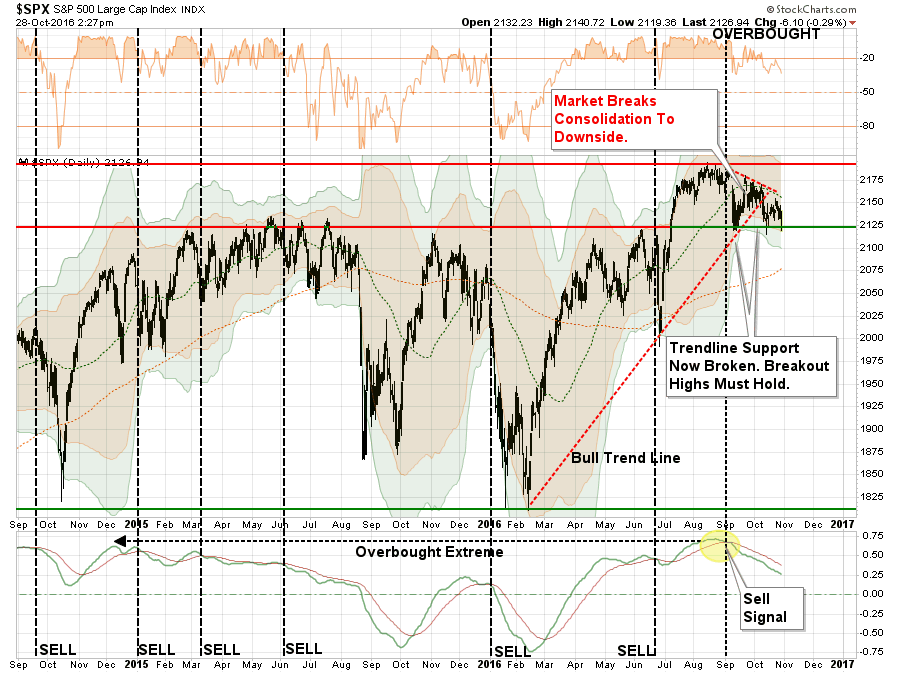
“If we zoom in we can get a little clearer picture about the breakdown.”
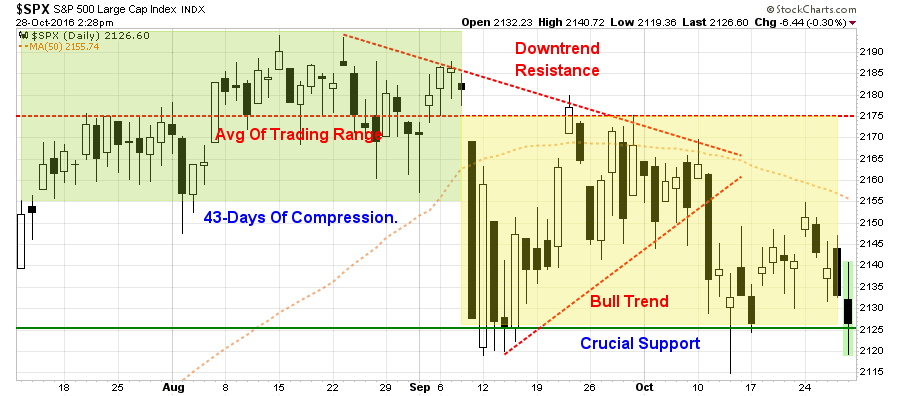
The two dashed red lines show the tightening consolidation pattern more clearly.
Importantly, while the market has remained in suspended animation over the past three months, the deterioration of the market is quite evident. However, despite the ongoing political circus, weak corporate earnings (considering the massive reductions in expectations since the beginning of the year), Apple (NASDAQ:AAPL) and Amazon (NASDAQ:AMZN) both missing expectations (which really goes to the heart of the consumer,) and consumer sentiment waning, it is surprising the markets are still holding up as well as they are. As long as the markets can maintain support around 2125, the bull market is still in play, but at this point, not by much.
More importantly though, despite the ongoing defense of support at current levels, the deterioration in momentum and price action has now triggered intermediate and longer-term “sell signals” as shown below.
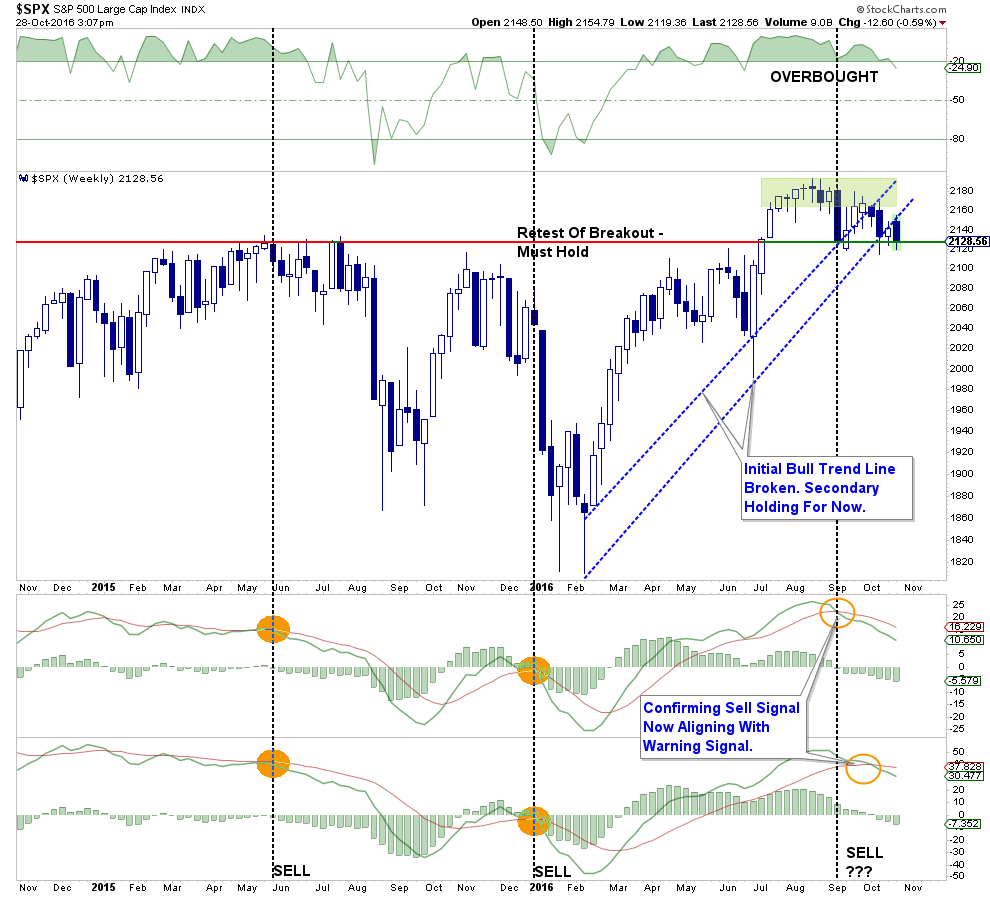
Importantly, notice that both of the previous bullish trend lines (depending on how you measure them) have now been violated. Previously, when both “sell signals” have been triggered, particularly with the market overbought as it is now, the subsequent decline has been rather sharp.
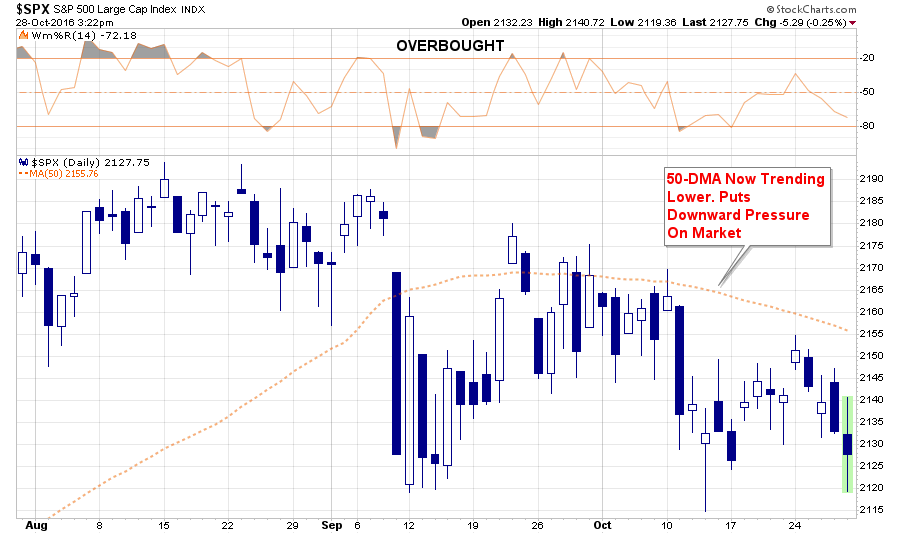
Lastly, as stated above, the 50-dma moving average has begun to trend lower, the downtrend resistance from the previous market highs remains present and the “sell signal” occurring at high levels suggests the risk of a further correction has not currently been eliminated.
As stated last week, and remains this week:
“It is important, as an investor, is not to ‘panic’ and make emotionally driven decisions in the short-term. All that has happened currently is a ‘warning’ you should start paying attention to your investments.”
Just be cautious for the moment.
Economy About To Hit The Dollar “Wall”
Since early May, I have continued to maintain an outlook for a stronger dollar as higher U.S. interest rates continue to attract foreign inflows.
As I wrote several weeks ago:
“As shown below, a stronger dollar will provide another headwind to already weak earnings and oil prices in the months ahead which could put a damper on the expected year-end ‘hockey stick’ recovery currently expected.”
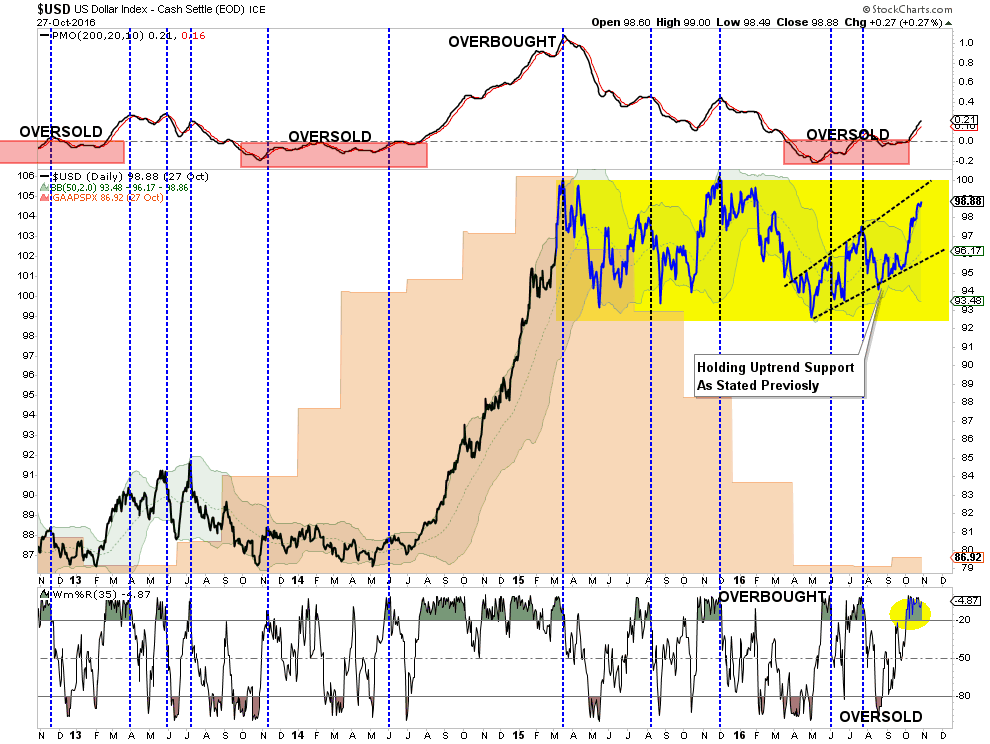
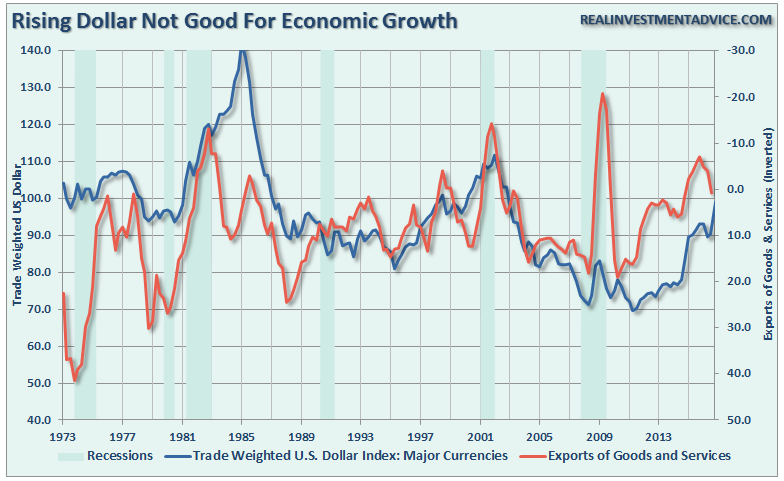
Of course, the real problem of a stronger dollar at this juncture is that it weighs on exports which comprise about 40% of corporate earnings. As I stated last week:
“The dollar rally could be a real problem with respect to the earnings recovery story going into the end of the year. With an already weak economy, a stronger dollar means weaker exports for companies and a drag on corporate profitability.”
The chart below shows the relationship between exports and the dollar.
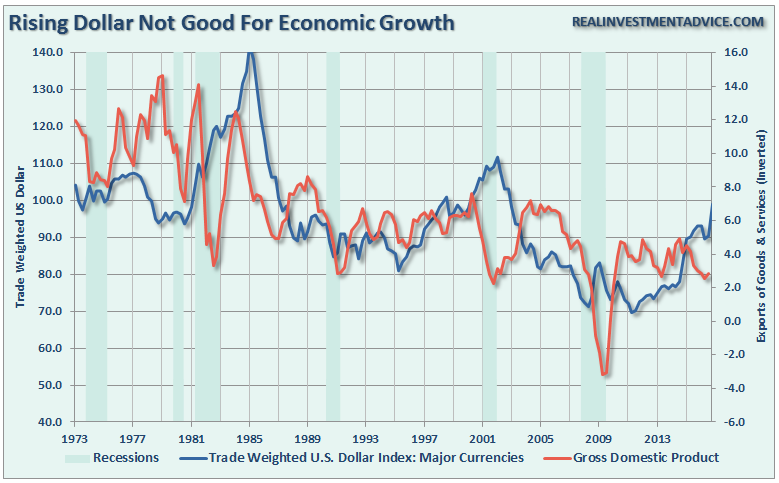
Of course, despite the “whooping and hollering” over the advance print of GDP at 2.9% on Friday, such exuberance may be a tad premature as the next chart shows the relationship between the dollar and the economy itself.
This is particularly interesting given the recent number of companies trying to lay off weak earnings reports on the election. As Paul La Monica wrote this past week:
“This contentious and seemingly never-ending presidential election campaign makes me want to eat more comfort food to boost my spirits.
But maybe I’m alone. Executives from several food companies — as well as other big consumer brands — have warned in recent weeks that the Donald Trump versus Hillary Clinton battle for the White House is actually hurting their results.”
Whether it was the CEO of Dunkin’ Brands (NASDAQ:DNKN), which owns both Dunkin’ Donuts and ice cream chain Baskin-Robbins, McDonald’s (NYSE:MCD), YUM! Brands (NYSE:YUM) or Popeye’s Louisiana Chicken (NASDAQ:PLKI), they all pulled the excuse the election was hurting their results.
As Paul goes on to state:
“Really? It seems hard to imagine that people are passing up the opportunity to have an iced coffee and a cronut or some fried chicken and cheeseburgers just because they are scared of what either a President Trump or Clinton would do to the economy.”
Paul is absolutely right. The poor results from restaurants or consumer good related companies like Apple and Amazon aren’t missing results due to the election, but rather these are early signs of a consumer that is being impacted by they triple whammy of rising borrowing costs, weak wage growth and spiraling health care costs thanks to the “Un-Affordable Care Act.”
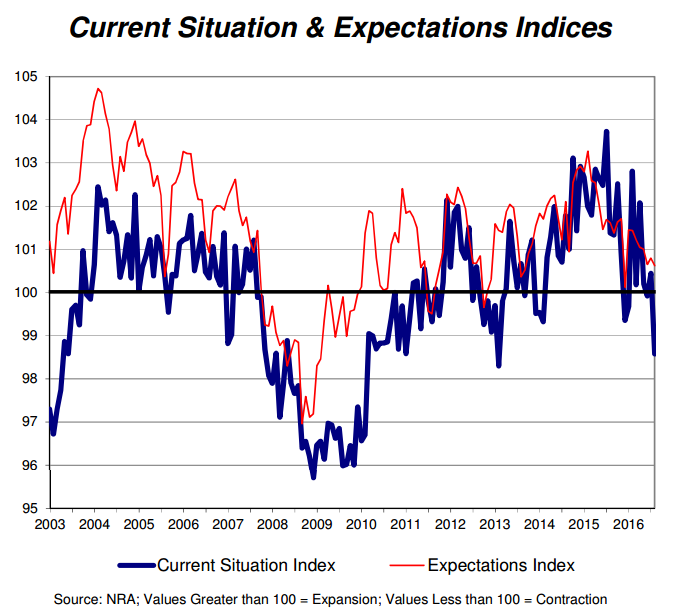
Of course, this is clearly seen in the report from the National Restaurant Association as consumers are forced to choose between eating out or paying for health care costs.
“Due in large part to declines in both same-store sales and customer traffic, the National Restaurant Association’s Restaurant Performance Index (RPI) fell below 100 in August.”
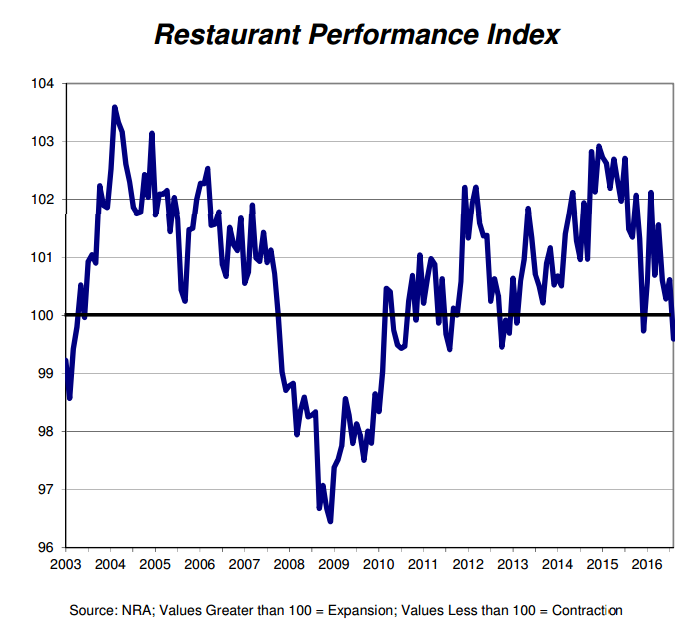
“The RPI fell below 100 for the first time in eight months, as a result of broad-based declines in the current situation indicators. Restaurant operators reported net declines in both same-store sales and customer traffic in August, along with corresponding dips in the labor indicators.
The RPI is constructed so that the health of the restaurant industry is measured in relation to a steady-state level of 100. The Restaurant Performance Index consists of two components – the Current Situation Index and the Expectations Index. Current Situation Index Fell 1.9 Percent in August to a Level of 98.6; Expectations Index Edged Down 0.2 Percent to a Level of 100.6.”
While no one is watching or worrying about the dollar right now, I can assure you they will be soon if the rise continues.
10-Year Treasury Beats Yellen To The Punch
Wall Street has put pretty high odds on Janet Yellen hiking rates come December. To wit:
“While the probability of a November rate-hike has collapsed to just 8.5% (as December holds around 65%) it appears regional Federal Reserves have a very different perspective of when Janet should hike. Nine of the Fed’s 12 regional banks sought a quarter-point increase in the discount rate in September, up from eight in August, based on minutes of their board meetings published by Fed. This is the same number as right before the December hike in 2015.”
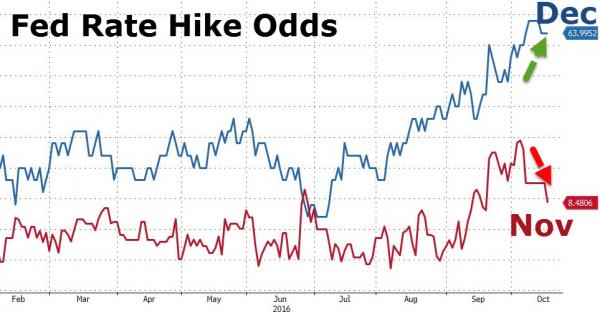
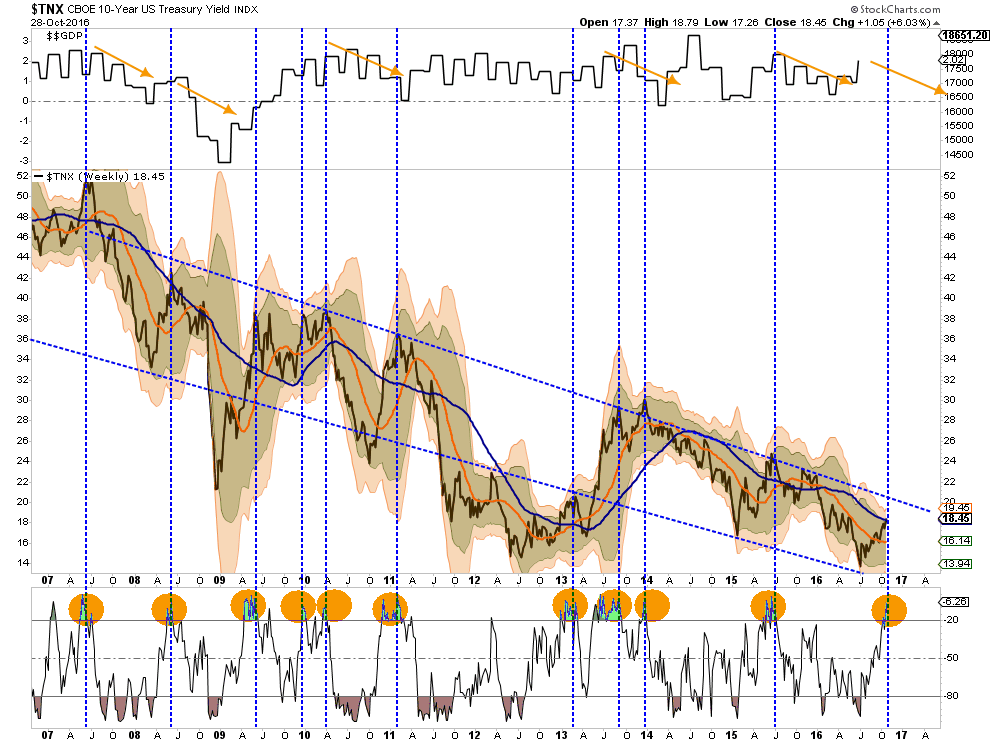
The problem, however, is that every time the Federal Reserve has tried to hike rates over the last couple of years some form of “global instability” has cropped up that has kept them on hold. The problem, this time, is the “instability” may be domestic as the recent surge in the 10-year interest rate has front-run the Fed in tightening monetary policy and putting the brakes on economic growth.
As shown in the chart below, while rates remain in a very defined downtrend, each push to higher levels resulted in an economic slowdown with a bit of a lagged effect. With rates now as overbought as at any prior point, it is likely the “brakes” are already being applied and will show up in weaker retail sales, consumer spending, and capital investment reports in the not so distant future.
As I pointed out in this past week’s report “Better Hope Rates Don’t Rise,” there are a litany of problems with higher rates:
1) Sharply rising rates will immediately curtail that growth as rising borrowing costs slows consumption.
2) The Federal Reserve currently runs the world’s largest hedge fund with over $4 Trillion in assets.
3) People buy payments, not houses, and rising rates mean higher payments.
4) An increase in interest rates means higher borrowing costs which lead to lower profit margins for corporations.
5) One of the main arguments of stock bulls over the last 8 years has been the stocks are cheap based on low interest rates.
6) The massive derivatives market will be negatively impacted.
7) As rates increase so does the variable rate interest payments on credit cards.
8) Rising defaults on debt service
9) Commodities, which are very sensitive to the direction and strength of the global economy.
10) The deficit/GDP ratio will begin to soar as borrowing costs rise sharply.
You get the idea. The problem is that with economic growth already running at extremely weak levels, it won’t take much of a rise to put the overall economic underpinnings at risk.
Recession Risk On The Rise
Just recently, Deutsche Bank Chief U.S. Economist Joseph LaVorgna, wrote:
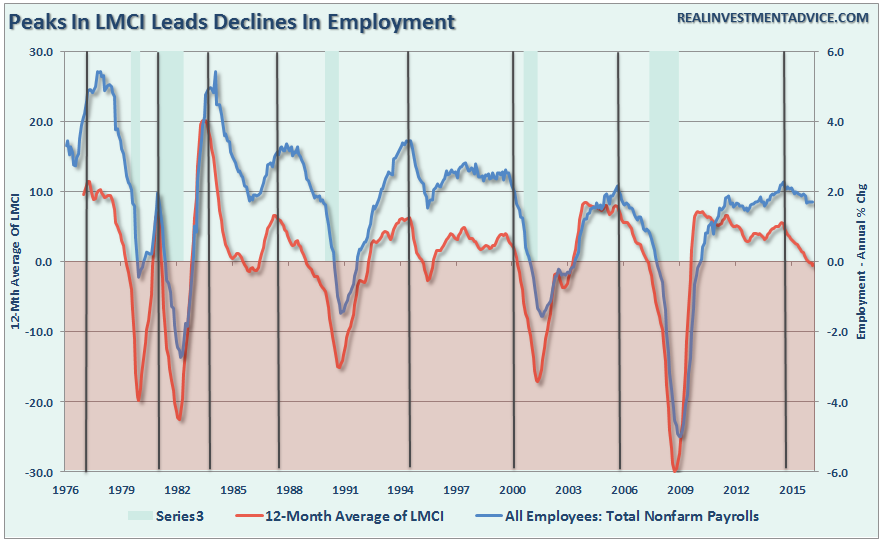
“That’s only the eighth time in nearly 40 years the index was down on a year-over-year basis. Of the seven previous occasions, four were soon followed by recession. (In the three other cases, two were false alarms, in 1986-87 and 1995-96, and in 1981 the recession began shortly before the annual change in the LMCI [Labor Market Conditions Index] turned negative.)
The weakness in the LMCI indicates a rising possibility of recession. The upshot is that the economic outlook remains fragile despite the ostensible robustness of the labor market.”
I take a little different look at the LMCI by using a 12-month average of the monthly changes. What is notable is despite all of the cheering over monthly labor reports, which has been “quantity” over “quality,” what has been overlooked is the declining trend in the data.
It’s not just Deutsche Bank that is warning about the fact we are very late in the current economic cycle, but also by former raging bull David Rosenberg in a recent Financial Post article:
“The yield curve is flattening. Leading economic indicators are sputtering. Uber-tight credit spreads and ultra-low cap rates in real estate serve as confirmations of late-cycle pricing.
Traditional valuation metrics for equities are every bit as high if not higher than they were in the Fall of 2007.
We are well past the peak in autos and just passed the peak of the housing cycle. Not just that but the broad measures of unemployment have stopped going down as well.
And the mega ‘Merger Mania’ we are seeing invariably takes place at or near cycle peaks, as companies realize that they can no longer grow their earnings organically. We have just witnessed five multi-billion dollar deals this past week alone — $207 billion globally (AT&T / TimeWarner; TD Ameritrade / Scottrade) in what has been the most active announcement list since 1999 … what do you know, near the tail end of that tech bull market too.
We also were at the receiving end of a really disappointing consumer confidence report out of The Conference Board — sliding to a three-month low of 98.6 in October from 103.5 in September, the sharpest slide of the year.
And it wasn’t just the politics or gas prices — just a general malaise.
Assessments of business conditions now and perceptions for the next six months deteriorated significantly, as they did for the jobs market and spending intentions for homes and appliances.
This sentiment index generally peaks between 60% and 70% of the way through the cycle and so if that traditional pattern holds for this one, it would mean bracing for a recession to start any time from October 2017 to May 2018.
Forewarned is forearmed.“
This analysis confirms my previous suggestions we are approaching a recession sometime next year. With rising labor costs, interest rates and a stronger dollar, the Fed is on a collision course with a recession. This was noted by ECRI’s Lakshman Achuthan just recently:
“In a recent interview with Financial Sense, Achuthan, explains how demographics and slowing productivity are key to understanding long-term trend growth, something that monetary and fiscal policy may do little to change.
‘We’ve been in a growth rate cycle slowdown for almost two years now, where the broad measures of current economic activity, which define the business cycle or the economic cycle…are in a slowdown,’”
As I have repeatedly stated, you can not support higher interest rates, or have an inflationary pickup, without underlying economic growth.
“As you can see there is a very high correlation, not surprisingly, between the three major components (inflation, economic and wage growth) and the level of interest rates. Interest rates are not just a function of the investment market, but rather the level of “demand” for capital in the economy. When the economy is expanding organically, the demand for capital rises as businesses expand production to meet rising demand. Increased production leads to higher wages which in turn fosters more aggregate demand. As consumption increases, so does the ability for producers to charge higher prices (inflation) and for lenders to increase borrowing costs. (Currently, we do not have the type of inflation that leads to stronger economic growth, just inflation in the costs of living that sap consumer spending – Rent, Insurance, Health Care)”
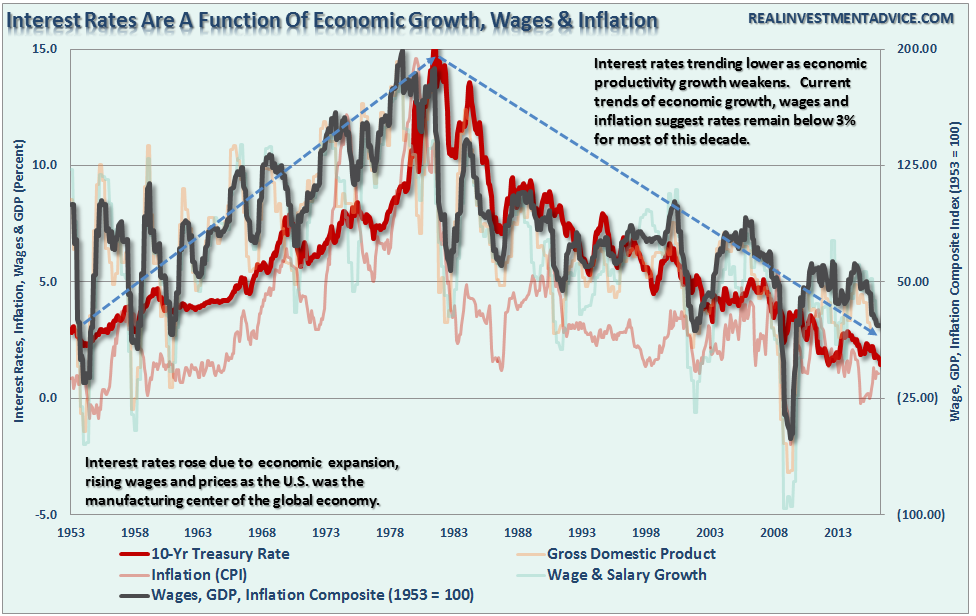
“However, in the current economic environment, this is not the case.”
While many are predicting “no recession” in sight, the economic data currently does not support that call.
Why do we care? Because during recessions stocks have historically lost about 1/3rd of their value. After two previous bear markets since the turn of the century, you really can’t afford the risk of going through a third one.
As David said, above, “forewarned is forearmed.”
THE MONDAY MORNING CALL
The Monday Morning Call – Analysis For Active Traders
This Market Needs Traction
Michael Sincere had a very interesting post this past week in which he looked at the deterioration of the market. He noted:
“Here’s something else to consider: For the past two years, the market has been in a sideways pattern, i.e., it’s eked out a small gain. Investors are getting anxious to generate any return on their money, just one of the many reasons they are dumping managed funds, and the reason they are desperately seeking yield. In my opinion, this is the time to be patient while waiting for the right opportunity. Anyone trying to force the market to give them money is going to be sorely disappointed in the near future.
Because Halloween and the election are drawing near, I don’t want to scare you. Nevertheless, the warning signs are everywhere. Once again, the strongest case for the bulls is the “invisible hand,” the entity that frequently spikes the indexes higher whenever the market starts to sell off. As I’ve said before, fear will overwhelm the invisible hand one day, but until then we can expect to get this drip-drip-drip type of selloff on low volatility.
Bottom line: The odds favor the bears in the near future. Keep your eye out for 2,130 on the S&P 500. If we drop below that level and the 200-day moving averages on the S&P 500, it could get nasty. Raise cash as we move closer to a correction. The biggest surprise is that we haven’t had one yet.”
I couldn’t agree more, and the market needs to get some traction quickly as crucial support is currently being tested. As shown in the chart below, bullishness remains high despite the recent sideways action of the market. This provides fuel for a correction should something panic investors.
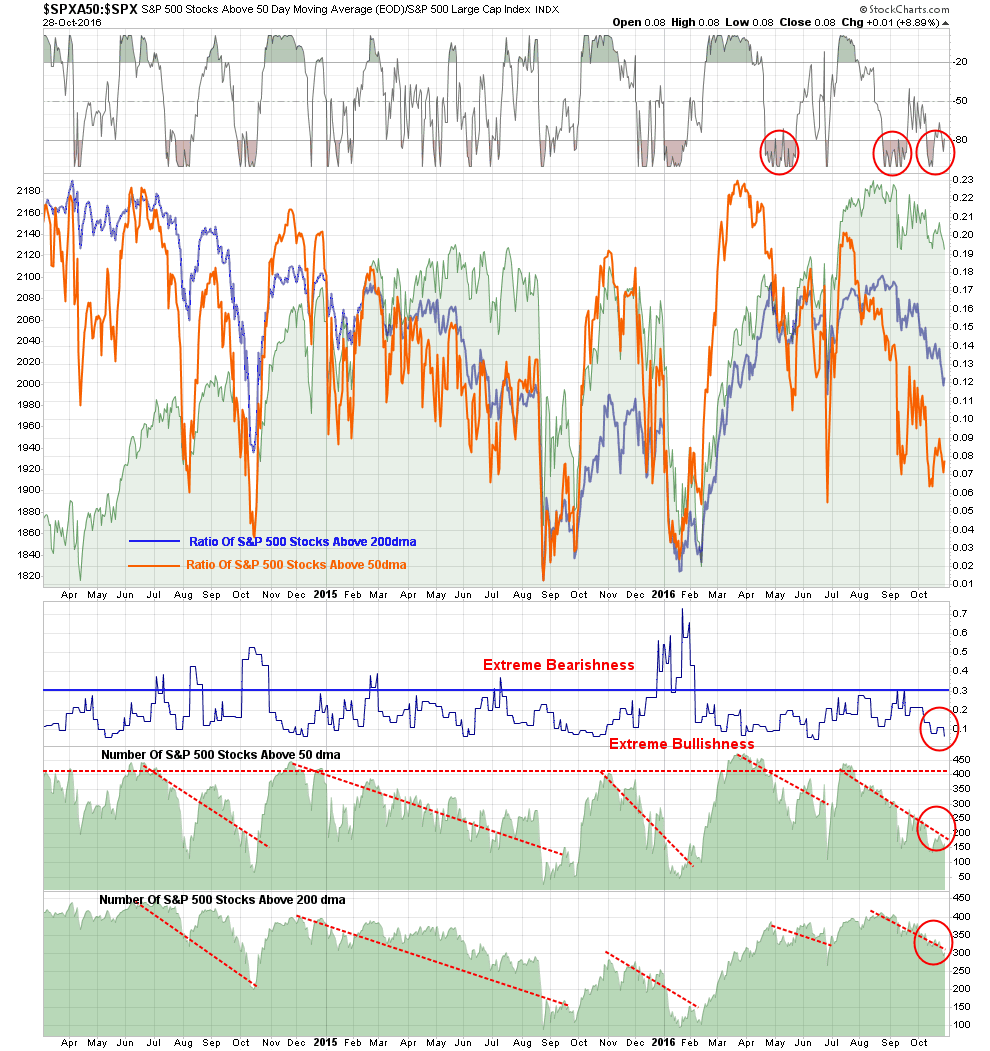
Furthermore, the deterioration in the breadth of the market is also concerning as shown above and below. With relative strength, momentum and breadth all on the decline, Michael is correct in stating the short-term outlook favors the bears momentarily, so caution is advised.
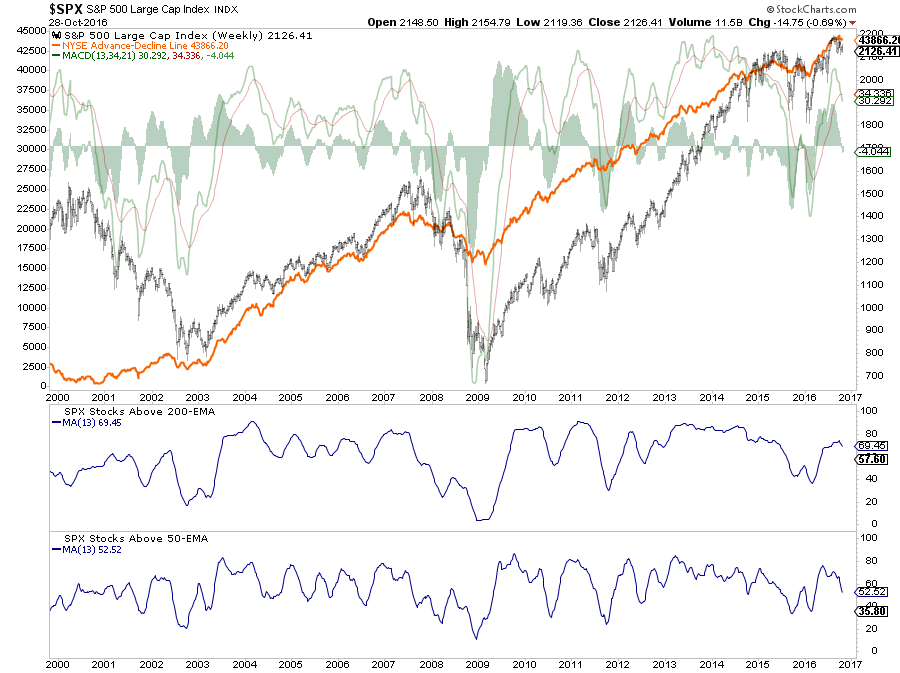
With multiple sell signals in place, as shown throughout the entirety of this week’s newsletter, the call for next week remains higher cash levels and reduce levels of equity risk for now. When market dynamics change to a more constructive backdrop there will be plenty of time to increase allocations to equities with a more favorable risk/reward potential.
That is not the case right now.
